Both Google Search Console and GA4 now support custom annotations. Google Search Console allows up to 200 annotations per property. GA4 allows up to 1000 annotations per property. However, both tools only support site-level annotations.
Tool | Max Annotations Per Property | Annotation Text Fields | Character Limits |
Google Search Console | 200 | Single Note Field | Max 120 Characters |
Google Analytics | 1000 | Title + Description | Title: 60 Characters Description: 150 Characters |
SEOTesting | Unlimited | Unlimited | Unlimited |
SEOTesting offers more granular annotation capabilities. You can annotate at the:
- Site level
- Page level
- Query level
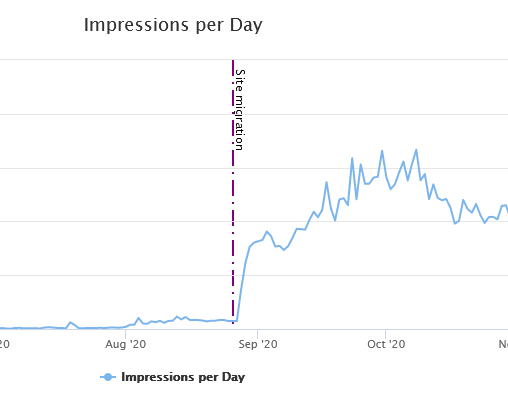
Page-level and query-level annotations help you track specific changes. They help you diagnose shifts for individual pages and search queries. Google Search Console and GA4 do not offer this level of detail.

The above image shows page-level annotations in SEOTesting.
How to Annotate Google Search Console Data
Google Search Console now allows you to add custom annotations to your data. This feature helps you understand changes in your data. It provides context on your charts.
There are two types of annotations.
System Annotations
Search Console generates these annotations. They show issues with data processing and reporting.
Custom Annotations
You create these notes yourself. They mark important events for your property. Examples include launching a new feature or fixing a bug on your website.
Annotations appear on your charts for a specific date. You will see them regardless of what filters you apply. They will not show up in comparison mode. They will not show up in 24-hour views.
How to Add, View, and Delete Custom Annotations
You can add and delete annotations to track your important events. Annotations are shared across your property. Any owner or full user of the property can:
- Add
- View
- Delete
Any annotation. A restricted user can view annotations. A restricted user cannot add or delete annotations.
To Add An Annotation:
You can have up to 200 annotations on a single property.
Open the Performance report:

Right-click the chart on the specific date you want to annotate:

Select a date using the date picker:

Type your note in the text field. You have up to 120 characters:

Click Add:

To View and Delete an Annotation
Annotations older than 500 days are deleted. This happens automatically.
Click the annotation marker on the chart to see the note:

Select DELETE in the annotation pop-up window:

Select Cancel or Delete on the following screen. This will cancel or confirm the deletion:

Editing annotations is not available. This feature does not exist yet.
How to Annotate Google Analytics (GA4) Data
Google Analytics 4 now allows users to add annotations to reports. Annotations let you add notes to your reports. This makes it easier to record events. It helps you explain changes in data. It helps you highlight key observations for yourself and your team.
You can use annotations to identify and explain spikes or dips in traffic. You can mark campaign launches. You can mark product launches. You can track other important events.
Before You Begin
You must be an Analyst or above at the property level. This allows you to:
- Create
- Edit
- Delete
Annotations. Viewers can view annotations. They cannot create, edit, or delete them.
Each property has a limit of 1000 annotations.
You can create annotations in two places. You can create them in Google Analytics Reports with line graphs. You can create them using the Admin API.
Create an Annotation
In Google Analytics, click Reports on the left:

Open the report you wish to annotate:

Right-click any data point on any line graph:

Click Add Annotation:

Add these annotation details:
- Title: The character limit is 60 characters.
- Description: The character limit is 150 characters.
- Date or date range: You can select a single date or a date range.
- Color

Click Create annotation:

Any annotation will be visible across all reports and report cards with line graphs. You can hide all your annotations. You can hide annotation bars for date ranges.
Note: If you have a high number of annotations with overlapping date ranges, create annotations for a single date instead. This is recommended.
View Annotation Details
An icon appears below the line graph on the report. This happens when you create an annotation. Hover over the icon to view the annotation details in the hover card. Click the annotation icon to view details in the “Annotations Viewer” panel.
View All Annotations for a Property
In Google Analytics, click Admin on the left:

Under “Data Display”, click Annotations:

View the details of all annotations for a property. You may be able to create, edit, delete, or export these annotations from Admin. This depends on your access level.
Change Your Annotation Settings
You can change your annotation settings in the “Annotations Settings” section. This section is found at the bottom left of the “Annotations Viewer” panel. You can use a toggle to hide or unhide all your annotations. You can hide or unhide annotation bars for date ranges. When you change your settings, this will apply to all of your annotations.
Google Analytics-Created Annotations
Google Analytics may create an annotation when a significant data-impacting event occurs. This notifies users about the issue on the relevant date and data. These annotations look similar to user-created annotations. You cannot edit or delete them. Hover your mouse cursor over the system annotation icon to view details.
Using SEOTesting to Improve Analytics Annotations
You can use SEOTesting to add annotations to your Google Search Console data.
SEOTesting takes its data from the Google Search Console API. The data you see in SEOTesting matches the data in Google Search Console. The data is identical. We allow you to add annotations at three levels:
- Site Level
- Page Level
- Query Level
You will find the Annotations link in the main left-hand navigation. This appears when you work inside an individual site.
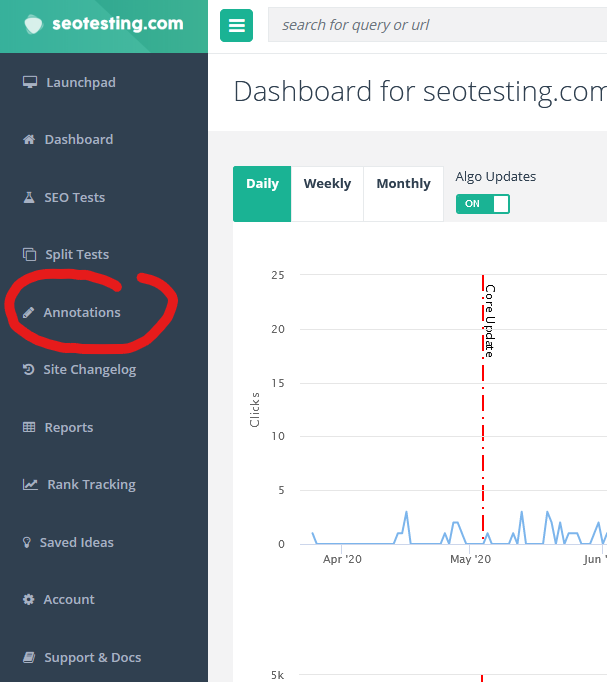
Click on the annotations link. You will see existing annotations. You will also see the button to create a new one.
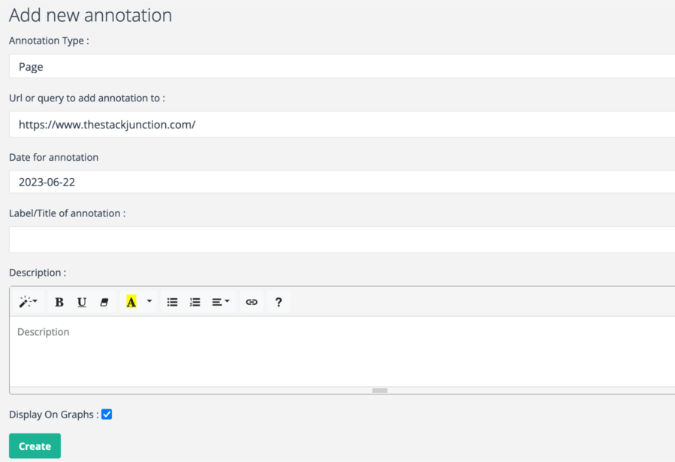
You can annotate at three levels:
- Site
- Page
- Query
Site annotations appear on individual page and query reports. This makes sense. Anything that affects the entire site should show for individual page and query views.
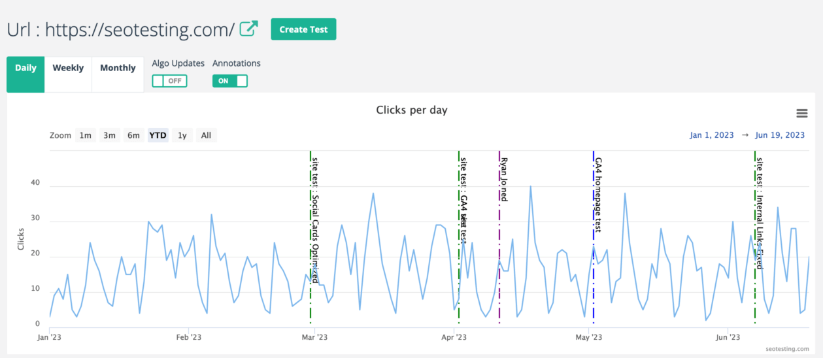
Add a good description when you create an annotation. This is worth doing. When you see annotations on a graph, you can click on the annotation label. You will see a view where these extra details appear.
SEO tests and annotations help you track what has changed. They explain why changes happened. The Site Changelog report rolls up all of these tests and annotations. This report orders each change. It groups them into months.
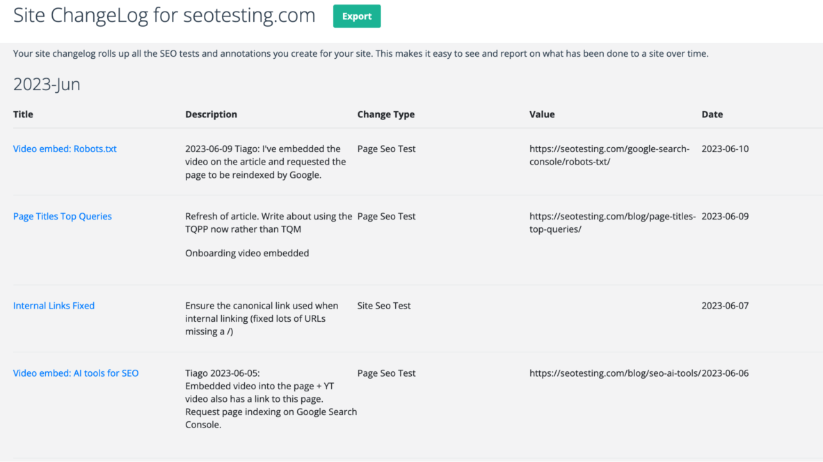
This report works well for SEO consultants and agencies. They use it for reporting to clients. It shows the work completed over each monthly period. It works for everybody who runs a website. It provides a historical record. This record shows what has changed over time.
Frequently Asked Questions
Can I add annotations in Google Search Console?
Yes. Google Search Console now allows users to add custom annotations. You can add up to 200 annotations per property. You create them by right-clicking on a chart in the Performance report. Each annotation can be up to 120 characters.
Can I annotate data in GA4 like I could in Universal Analytics?
Yes. GA4 now supports annotations. You can add notes to reports with line graphs. Each property allows up to 1000 annotations. You must be an Analyst or above to create annotations. Viewers can see annotations but cannot create them.
How do I add an annotation in GA4?
Open a report in Google Analytics. Right-click any data point on a line graph. Click “Add annotation.” Enter a title, description, date or date range, and color. Click “Create annotation.” The annotation will appear across all reports with line graphs.
What are the character limits for annotations?
Google Search Console allows 120 characters per annotation. GA4 allows 60 characters for titles and 150 characters for descriptions.
How can I annotate Google Search Console data in SEOTesting?
You can use SEOTesting to annotate your Google Search Console data. It pulls GSC data via the API. It allows annotations at three levels: site, page, or query level. This provides more granular tracking than native Google Search Console annotations.
What’s the benefit of using SEOTesting for annotations?
Annotations in SEOTesting help you track changes. They help you diagnose traffic shifts. They help you report to stakeholders more effectively. The Site Changelog report includes all annotations. This makes monthly reporting easy. You can annotate at the page and query level. Google Search Console does not offer this level of detail.
Do annotations affect SEO performance?
No. Annotations do not affect rankings. They do not affect search visibility. However, they help you analyze the impact of changes. They help you analyze external events. This makes it easier to manage SEO performance over time.
Testimonials
-

"Can totally recommend! It’s not only full of reports to easily identify low hanging fruit opportunities but also, the most straightforward platform to help run SEO tests"
Aleyda Solis, Intl SEO Consultant, Speaker & Author.
-

"SEOTesting.com has become one of my go-to SEO tools because it does so much with all the valuable data hidden in Google Search Console. It's the only thing that gives us the ability to use that data for keyword tracking, SEO tests, and quality testing."
Ruben Gamez, DocSketch