When looking at your search performance reports in Google Search Console, one of the most common metrics you will see is your average position metric. In this article, we will explain what the average position means and why it is important.
What is the Average Position Metric in Google Search Console?
The average position value is the average rank in the Search Engine Result Pages (SERPs) for the given time period selected in Google Search Console.
You can view the average position for the site as a whole, pages, queries, and queries by specific page.
How is the Average Position Calculated?
Google takes all the guesswork out of calculating your average position when showing you your data within Google Search Console.
When a user enters a query into Google, different (or even the same) pages from your site can actually appear in multiple organic positions and search features.
To calculate your average position, they take the topmost position (the position in which your search result was seen highest) and average this out across all searches of the query across the time period selected.
It’s worth remembering that localisation and personalisation affect the SERPs, so different people will see the search results in a different order. This different order is taken into account when calculating the average position.
Let’s use this as an example:
User 1 (Query : SEO Testing) returns your site at positions 2, 4, and 6. Google will class its position as 2 as this is the topmost position.
User 2 (Query : SEO Testing) returns your site at positions 3, 5, and 9. Google classes its position as 3 as this is the topmost position.
The average position across these two searches is 2.5. (2 + 3) / 2 = 2.5.
Using filters, you can go from the site average position and drill into page and query average positions.
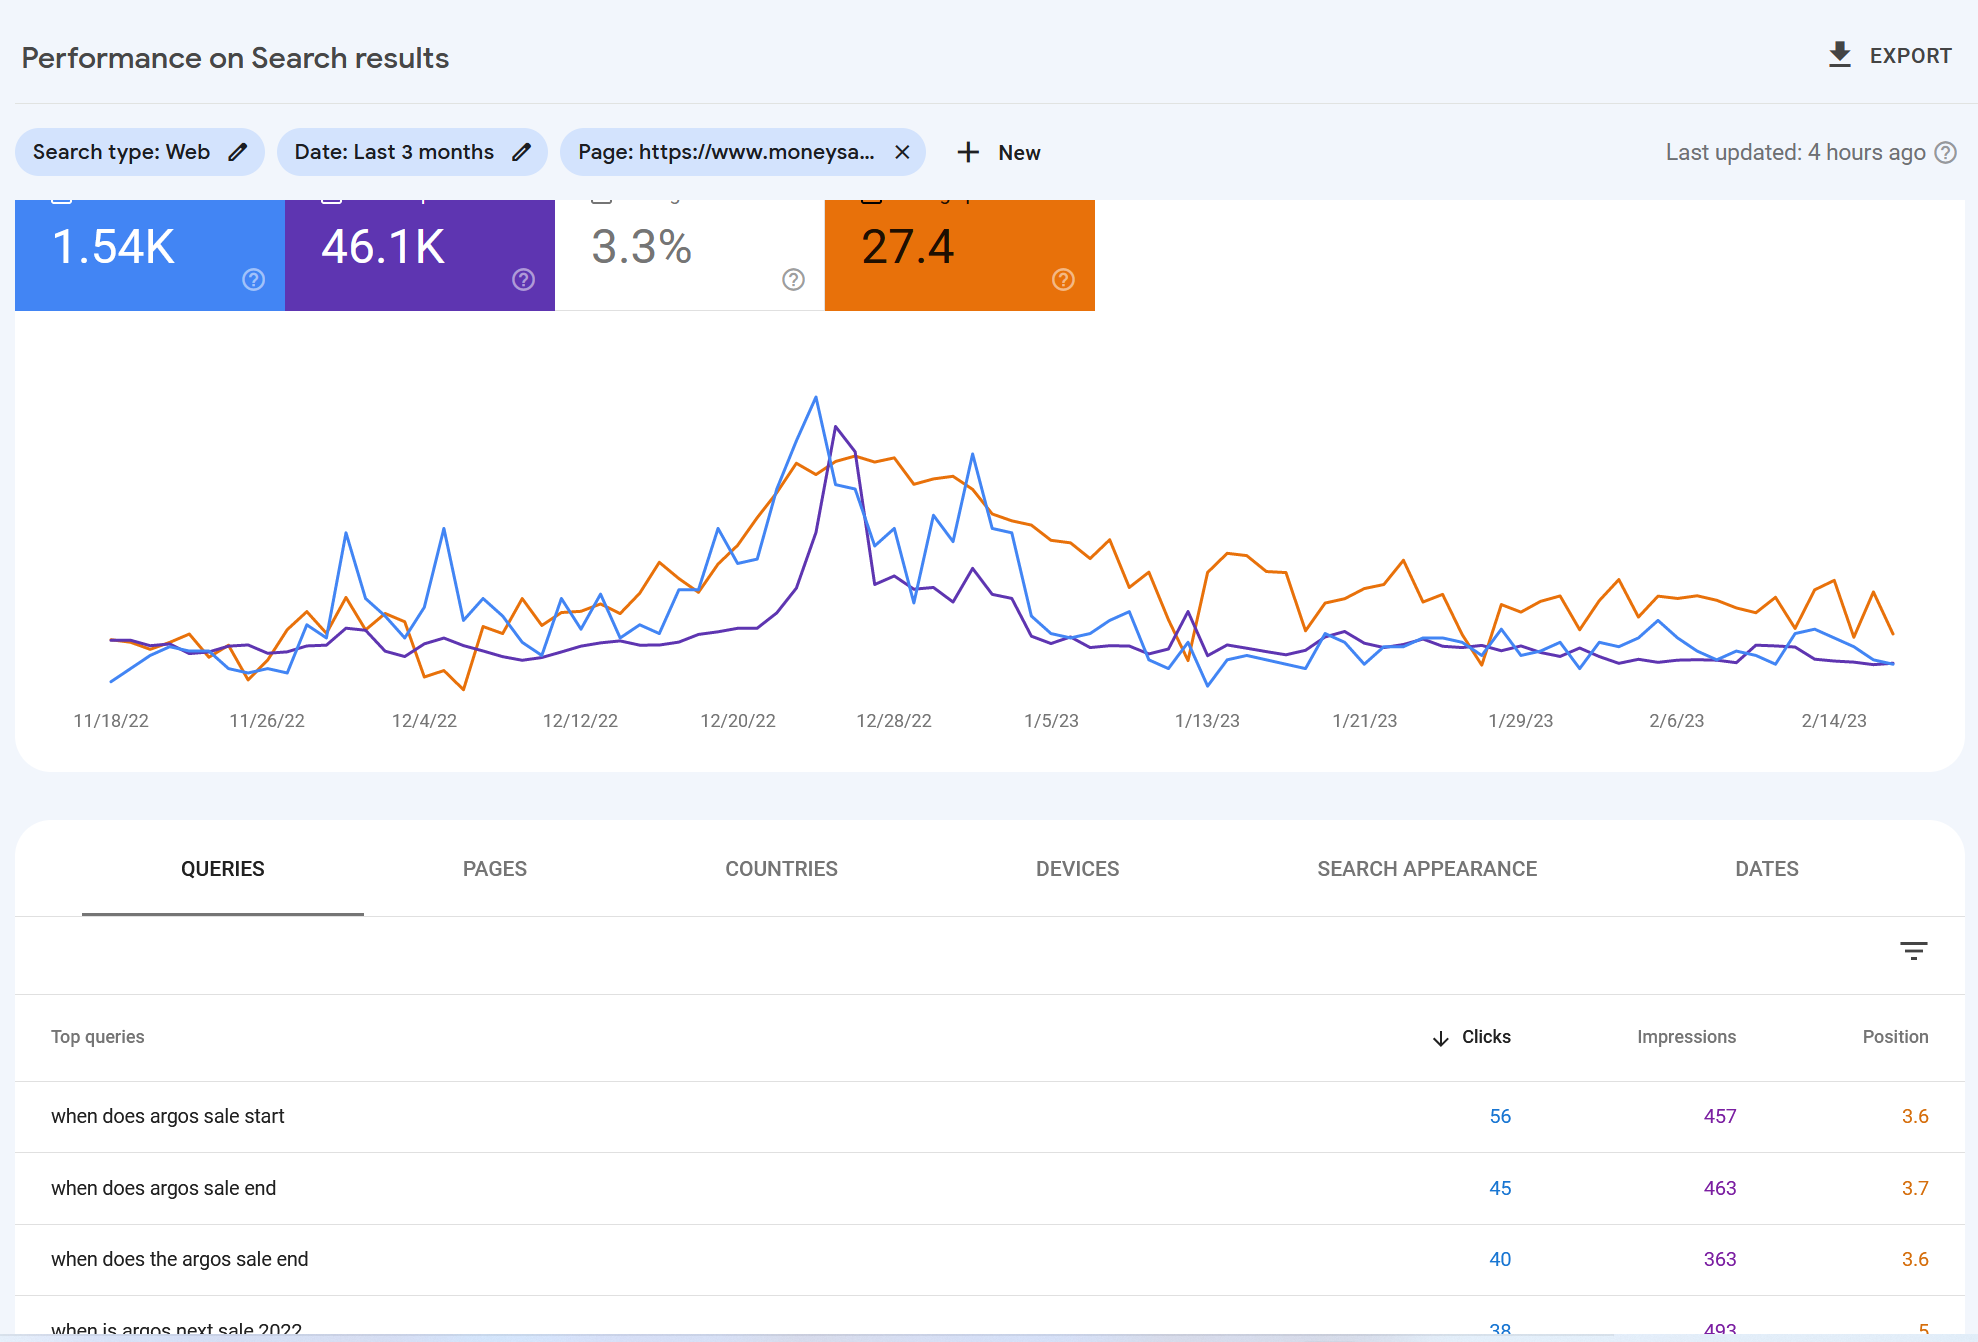
To drill down from the overall site metrics, above the performance graph, click ‘+ New’ to add an exact match URL filter.
Now you have filtered by page, the queries tab below the graph will show you the average position for individual queries the page is ranking for.
This is incredibly useful as it means you will be able to see how your site is doing as a whole, but also how individual pages and queries are performing.
The usefulness of the average position metric depends on the level you are viewing it.
Average Position for a Query on a Specific Page
When viewing an individual query or the list of queries a page is ranking for, the average position is a useful metric. This is because you are looking at this value at its most granular level.
The only caveat to this is for a query that gets only a few impressions in the SERPs for whatever date range you are looking at. Because it’s an average position, and due to localisation and personalisation, the average position reported for very low impression queries can fluctuate a lot and be very different from what you see in Google yourself.
With that being said, for queries that are getting a decent number of impressions each calendar day, if this value goes up or down, you can be confident this is a positional change that has occurred in the SERPs.
Page Average Position
The average position for a page can be a misleading value – and so we often do not pay too much attention to it.
The first reason is because it’s an average for the page across all the queries the page ranks for. Your page could rank in position 1 for the target keyword, but its average will be much lower because of all the other keywords it ranks for.
The second reason, especially if you are looking to refresh and improve the page, is if you do a good job, the page will start to rank for a larger set of queries. It’s likely again that the post-update average will be below average pre-update.
You can see this in SEO tests that people run. The number of queries the page ranks for goes up, and the average position goes down. If the clicks are increasing, ultimately, the update was a good result, and the average position can be ignored.
Site Average Position
Similar to the page average position, the site average position is an average of all queries across the entire site. While it may go up and down – it could be good or bad news.
If the site’s average position were to improve, it could mean all your rankings have improved. It could also mean your site has dropped out of the SERPs for many queries, and you don’t rank for them anymore at all.
If the site’s average position were to get worse, it could mean that your site has dropped positions for all the queries it ranks for, or it could mean your site has started to rank for a much larger set of queries, which has affected the overall average.
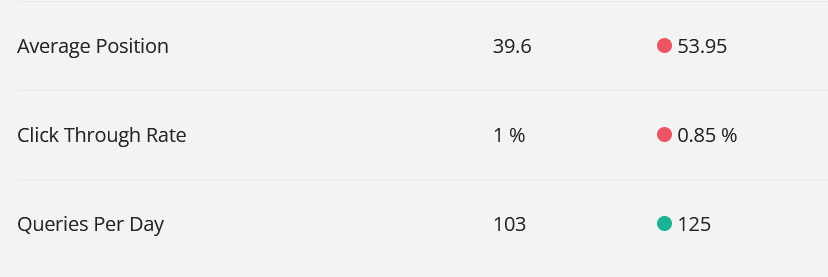
Ultimately, you need to consider the page and site average position with the other metrics in Google Search Console – clicks, impressions, and click-through rate and drill down into specific page and query metrics to determine if it’s good or bad news.
Can you rely on the Average Position reported in Search Console?
When you are using the filters in Google Search Console to drill down to the queries by page, or specific query, the average position in Google Search Console is a metric that is useful and can be tracked.
This is the reason we use the Search Console API to add a rank tracker to SEOTesting and the free rank tracker tool as a standalone app.
Frequently Asked Questions About Google Search Console’s Average Position Metric
What does average position mean in Google Search Console?
It shows the average ranking of a page or query in Google search results over time.
How is average position calculated in Search Console?
Google uses the highest-ranking position your page appears in for each search and averages that across all impressions.
Is average position in GSC accurate?
Yes. But personalization and location affect results. Accuracy improves with higher impression counts.
Why does my average position drop after an update?
Your page may start ranking for more keywords. These new keywords may rank lower and lower the average.
Should I track site average position in Search Console?
Not always. It can be misleading. It’s better to drill into page or query level metrics.
Testimonials
-

"Can totally recommend! It’s not only full of reports to easily identify low hanging fruit opportunities but also, the most straightforward platform to help run SEO tests"
Aleyda Solis, Intl SEO Consultant, Speaker & Author.
-

"SEOTesting has become one of my go-to SEO tools because it does so much with all the valuable data hidden in Google Search Console. It's the only thing that gives us the ability to use that data for keyword tracking, SEO tests, and quality testing."
Ruben Gamez, DocSketch