To continue our series on GA4, we’re going to discuss how you can use GA4 to give your business the best chance at online success. We will talk about:
- What GA4 is.
- What it’s used for.
- What the difference is between UA and GA4.
- How to set GA4 up.
- How to link GA4 to your Google Search Console account.
- The GA4 user interface.
So, let’s not waste any time and jump right into it.
What is GA4?
Google Analytics 4 (GA4) is a service developed by Google to measure traffic and engagement across websites and apps. It is built around first-party data, which comes directly from Google, making it one of the most accurate analytics tools on the market.
GA4 is the next generation of Google Analytics following Universal Analytics (UA). They have completely reworked how the tool measures and displays data, which we will discuss later in the article.
What is GA4 Used For?
While some marketers use GA4 to monitor their website traffic from different sources, it’s much more than that. This section will discuss some of the main use cases for GA4 and how to use it on your website and/or apps.
Analyzing User Behavior
GA4 tracks user behavior through an event-driven data model, which we will discuss later. This means that you can get great insights into events such as:
- Page views.
- Clicks.
- Online transactions.
Given that GA4 uses an event-driven data model, you can also create custom reports to help you better understand the different paths users are taking through your website. You can also use it to identify key engagement metrics and detect points where users are most likely to drop off your website.
Not only that, but GA4 also uses machine learning where possible, which means it can help you identify trends and anomalies in your data.
Informing an SEO Strategy
GA4 can help you inform your SEO strategy by providing information on how users find, land on, and interact with your website.
The software has a range of acquisition reports to help you find how users are coming to your site. You’ll see the number of users coming to your site through organic search, your most (and least) popular landing pages, and some search queries used to find your website.
GA4 can also help you monitor user engagement on pages when people interact with your site organically after landing on it. This can help you decide on changes you need to make to certain pages to keep these users on your site longer.
Improving Marketing Campaign Performance
Using GA4 for your marketing campaigns is a must. It’s not just for your SEO campaigns; you can utilize GA4 for almost all your online marketing campaigns to help you make better decisions and drive better results.
GA4 allows you to measure the impact of different campaigns across multiple channels. You can segment your audience based on their behavior, demographics, and traffic source. This will help you identify which of your marketing campaigns attracts the most valuable users.
GA4 also has a great feature known as ‘funnel analysis,’ which you can use to reveal where users are dropping off your site, which will help you improve these pages and drive better results. According to Fyresite, every extra second a user is on your site makes them more likely to buy. So, finding ways to keep people on your site longer is crucial.
Analyze Ecommerce Performance
One of the main improvements made following Google’s switch from UA to GA4 is the ability to track your website performance on a purely ecommerce basis.
The events-based data model within GA4 allows you to properly track events like product views, add-to-carts, and purchases. GA4 helps you understand the journey users are taking through the funnel, allowing you to make changes to your website based on this data to make it easier for your potential customers to move from the very top of the funnel to the bottom.
GA4 also allows you to utilize enhanced ecommerce reports to analyze product performance, average order value, and conversion rates. You can utilize this alongside its audience segmentation capabilities to be more personalized with your marketing, targeting your users based on previous interactions and purchase history.
Improving User Experience
Using GA4’s advanced analytics features, you can track detailed user journeys, identify the popular content on your website, and understand the flow traffic takes through your site. This allows you to identify friction points where people may drop off your site or have difficulties continuing their journey.
What is the Difference Between UA and GA4?
Universal Analytics and Google Analytics 4 have many differences. This section will discuss some of the main differences in more detail.
GA4 Uses Different Data Models
We have spoken about this a bit already, but one of the main differences between UA and GA4 is that GA4 uses a different data model entirely compared to UA. While UA relied on a session-based model, requiring users to accept cookies to track their activity, GA4 uses an event-based model. This means that every user interaction is tracked as an event.
This offers you more granular tracking and a better analysis of user behavior on your site. It also means that users do not need to accept cookies on their browsers; they are treated as events, which can be tracked without permission as no personal data is involved.
GA4 Utilizes Different Metrics & Ways of Measuring
GA4 uses different metrics and ways of measuring them. Within GA4, metrics are much more focused on user engagement, with a stronger emphasis on metrics such as:
- Engaged sessions.
- Engagement rate.
- Engagement time.
This shift in methodology provides a much more detailed view of how users interact with your content beyond just general page views and sessions.
GA4 Supports Cross-Device and Cross-Platform Tracking
One of my favorite changes from GA4 to UA is that GA4 supports cross-device and cross-platform tracking, which offers a more cohesive view of user interactions across different devices and platforms.
Today’s world is multi-device, and users are not searching on one device as much as they once did. In some cases, a buying journey could consist of a first visit performed on a desktop browser, a second on a mobile phone, and the final purchase made on a tablet. GA4’s cross-platform and cross-device tracking means all touchpoints are tracked within the analytics process!
More Privacy and Data Control
Regarding privacy and data control, GA4 has been built to offer features that comply with data protection regulations such as GDPR and CCPA.
It provides more robust data deletion mechanisms, allows for more nuanced data retention settings, and gives users greater control over the data that GA4 collects and how long it keeps it.
That’s before we mention GA4 using an event-based system to track events, meaning user data is much more private than ever without removing any important analytics information marketers need to get the job done.
Better Conversion Tracking Within GA4
Conversion tracking is now even more sophisticated within GA4 than in UA. The platform offers improved methods for tracking conversions, with the ability to create custom conversion events more aligned with your specific goals as a business. This flexibility helps you accurately measure how successful your marketing efforts are.
Not every business has a standard conversion, meaning something is purchased from the website. For some businesses, SEOTesting, for example, a conversion could be someone starting a free trial; another business may have a free ebook listed as a conversion. GA4 allows you options to track all of these events.
Differences in Reporting and Customization
Last but not least, there are notable differences in reporting and customization between UA and GA4.
GA4’s reporting interface is more streamlined and user-friendly, with many enhanced capabilities for custom reporting. Thus, you can set up custom reports for your business and goals.
The ‘Analysis Hub’ within GA4 offers powerful tools for creating detailed, customized reports that were not easily achievable within UA, which provides deeper insights and more actionable data.
We will discuss the different reports within GA4 later in the article.
How to Set Up GA4
To set up GA4 for your website, you must create a GA4 account in the Google Analytics platform. During the setup process, create a new property by entering the property name, selecting the right time zone, and selecting the currency you use.
Once this is done, provide your business details and select the objectives that align with your business goals, such as generating leads or increasing brand awareness.
Once the property is set up, you must create a data stream for your website. Enter your website URL and enable ‘enhanced measurement’ features to track additional interactions automatically. After setting up your data stream, the next step is to install GA4 on your website. This can be done manually by adding the GA4 tracking code to your website’s HTML, using Google Tag Manager, or through a website plugin like Google’s Site Kit for WordPress.
How to Link GA4 to Google Search Console
Linking your GA4 account to your GSC account gives you several advantages. It provides a combined view of your website’s performance by combining search data with on-site analytics. This integration helps you understand how search queries drive traffic to your site, track the performance of your keywords, and analyze user behavior post-click.
Additionally, it enables you to identify high-performing pages, optimize content based on search insights, and improve your SEO strategies by leveraging comprehensive data from both platforms.
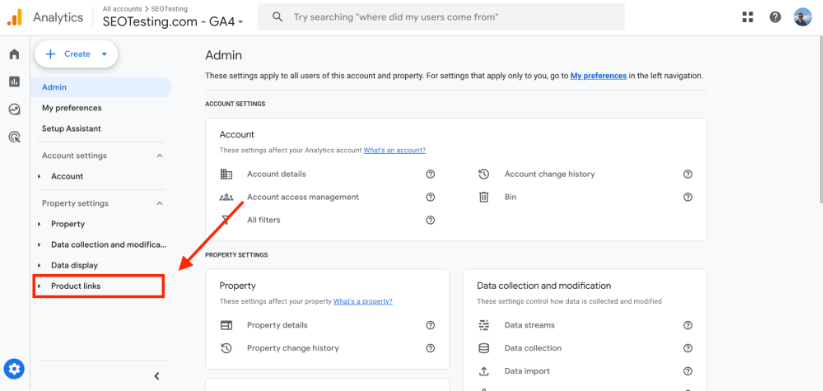
Start by logging into your GA4 account and clicking on the ‘Admin’ gear icon, which is located in the bottom-left corner of your screen:
Once here, click on the ‘Product links’ link, which is nested under the ‘Property settings’ section:
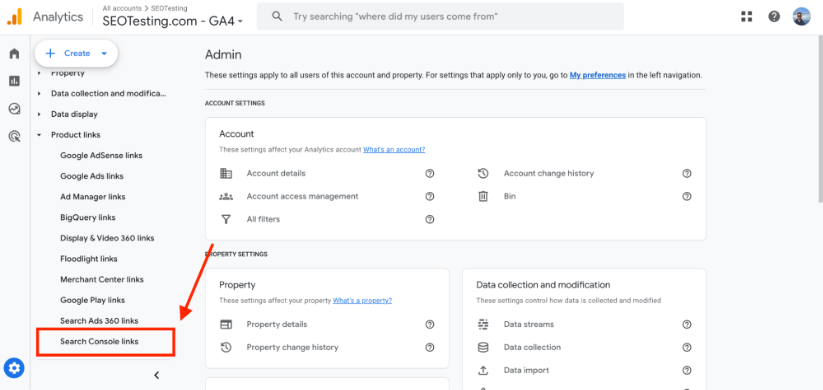
Once the above link has been clicked, a dropdown will appear. Click on the link to take you to Search Console links:
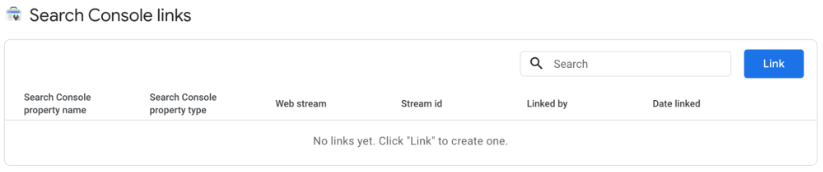
A new page will appear listing your current Search Console links (if you have any). Your next step will be to choose the Search Console account you want to connect. Click the blue ‘Link’ button that appears:
This will bring you to a new screen pop-up containing all the necessary link setup.
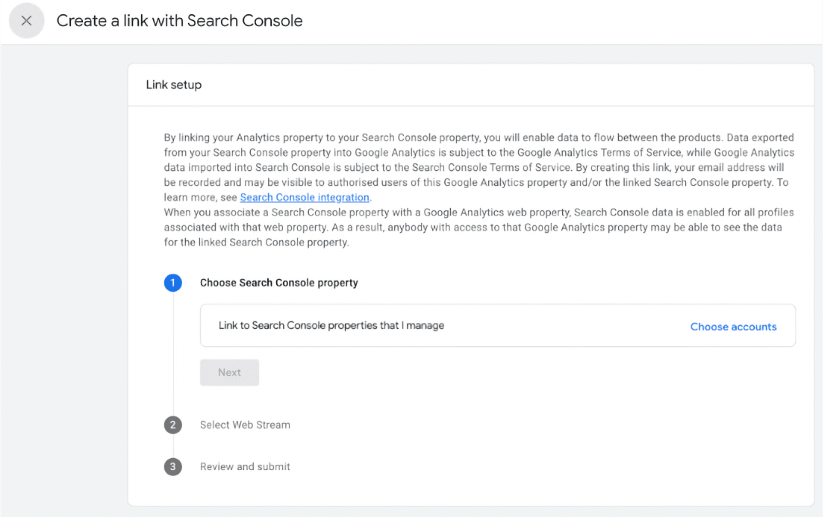
Click the blue “Choose accounts” link.
Note: To complete the next steps, you must be a verified site owner. For this article, we will assume you are.
Once you have clicked the “Choose accounts” link, you will be presented with a list of Google Search Console properties in which you are a verified site owner.
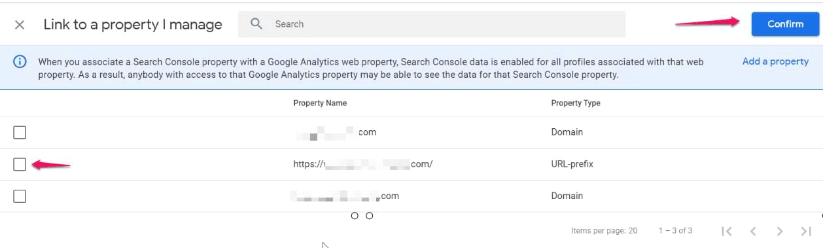
You can only link one GSC property with one GA4 webstream.
Once you have selected the Google Search Console property you want to connect, tick the box and click “Confirm,” as shown in the image above.
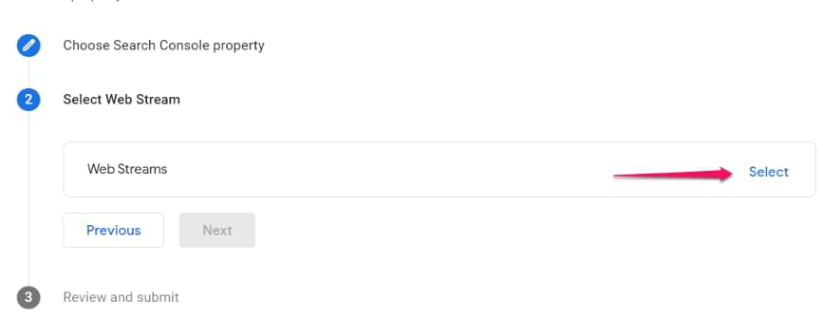
You will then move to the process of choosing a web stream. Click select and then select your web stream:
The final step is to review everything and click “Submit.”
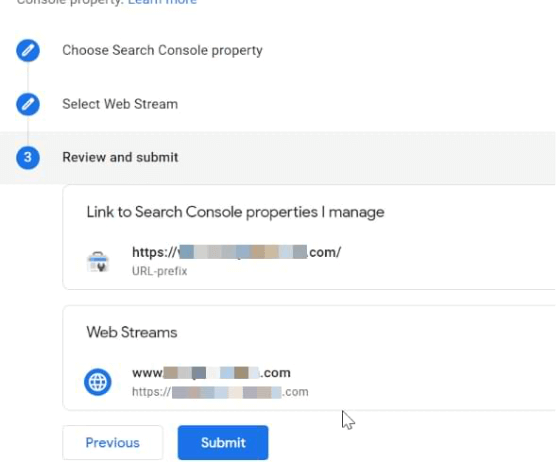
Once you have completed all these steps, you will see a green badge that confirms the link has been created.
You must wait up to 24 hours to start seeing data in your reports.
Exploring GA4’s Interface
The GA4 interface is split into three main sections:
- Reports
- Explore
- Advertising
Each of the three sections above has different features and sections within it. In this last section of the article, we will briefly overview everything you can find in GA4.
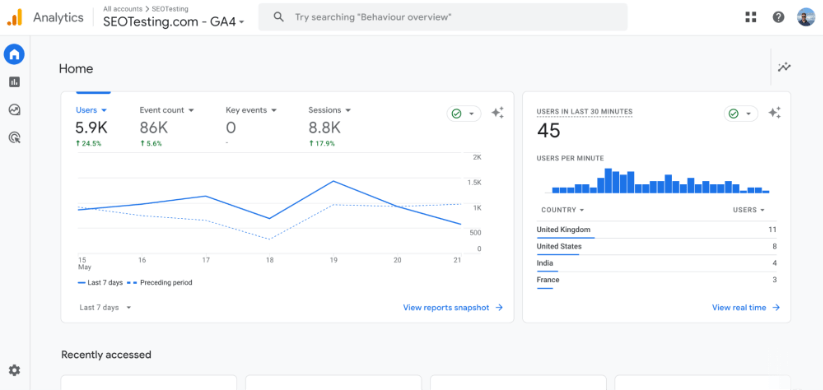
Home
The Homepage within GA4 is the ‘main hub’ where you can access the different reports and sections.
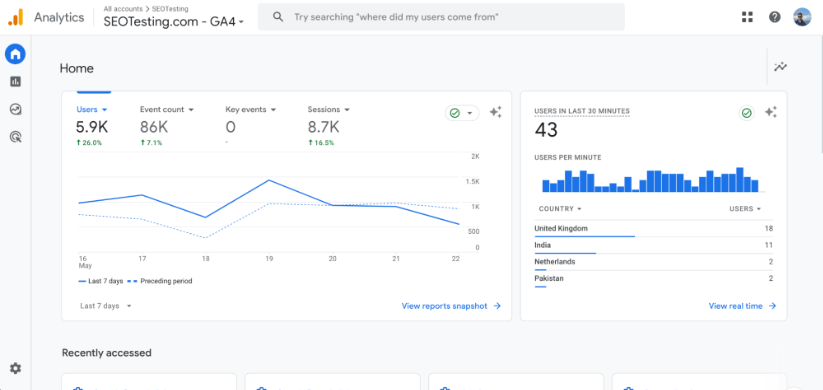
It also gives you a quick overview of important information about the website. Within your Homepage, you will find an overview of the last seven days of data compared to the previous seven. You will also have information about the users on your website who have been active within the last 30 minutes.
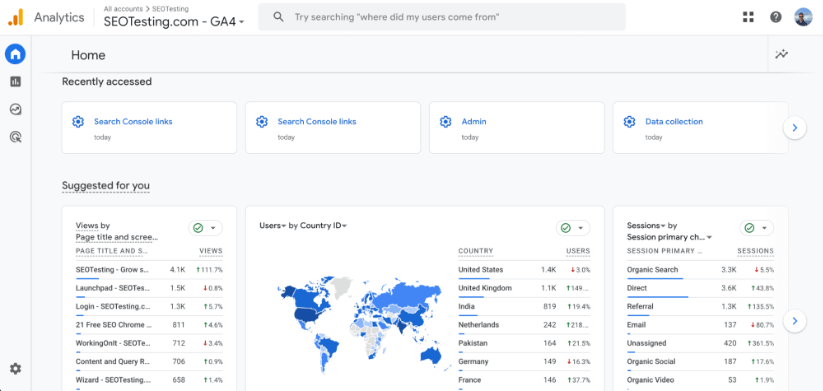
Scroll a little further down, and you will see the areas of GA4 that you recently visited (so you can return to them if need be) and some information that GA4 has specifically suggested for you.
Reports
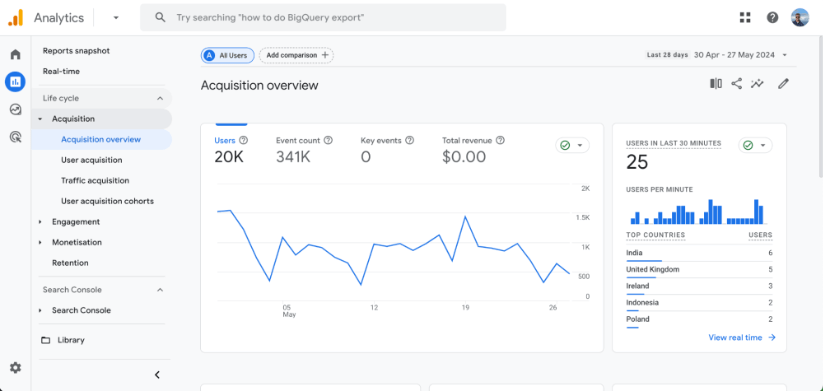
Starting in the ‘Reports’ section, you will be greeted with your ‘Reports Overview.’ This section within GA4 has been designed to give you a snapshot of important information without you having to click into different reports individually:
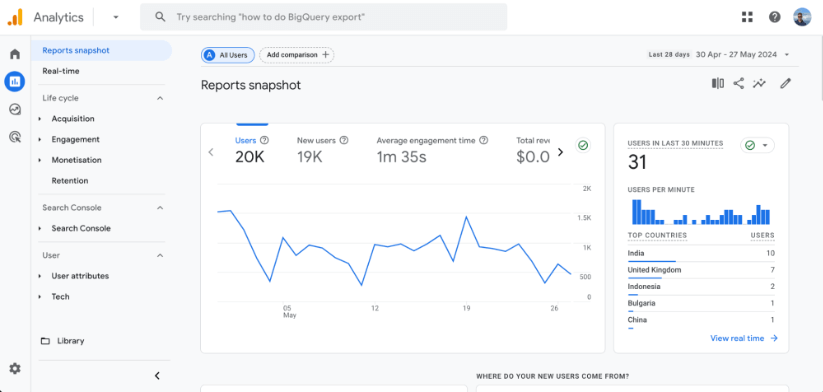
You will see a snapshot of your site’s number of users, new users, average engagement time, and total revenue within the past 28 days. You will also see a quick view of your website’s number of users in the past 30 minutes and where those users have come from.
Scrolling further down, you have access to even more useful information, including:
- Insights powered by Google’s machine learning.
- Where your users have been coming from.
- Which pages on your site have had the most views.
- What your top events have been.
Real-Time
Moving into the Real-time reports, these offer a live snapshot of user activity on your website. You can see the number of active users, where these users are based, the pages they are viewing, and the events they are triggering.
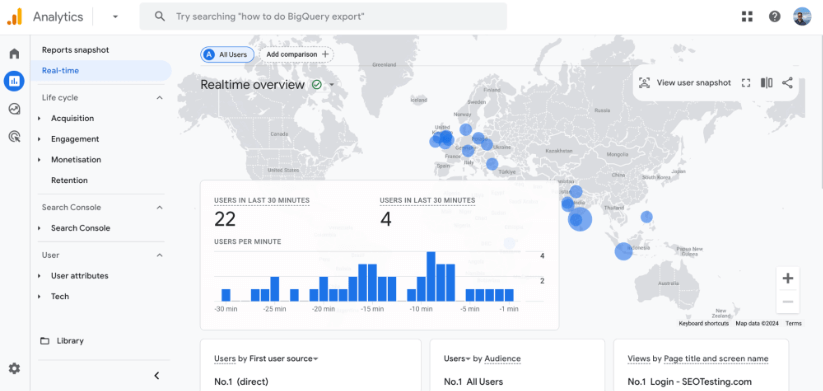
This information helps you monitor your website’s immediate performance, identify issues, and understand user behavior as it happens.
Acquisition Reports
Your Acquisition reports provide insights into how users arrive at your website. They detail the sources of your traffic, such as organic search, paid search, direct visitors, and referral traffic.
These reports help you understand which marketing channels effectively drive user engagement and conversions.
The Acquisition Overview report provides a high-level summary of how users arrive at your website. It gives you key metrics such as the total number of users and sessions and user engagement metrics like session duration and events triggered. This report gives you a broad understanding of the performance of your different acquisition channels.
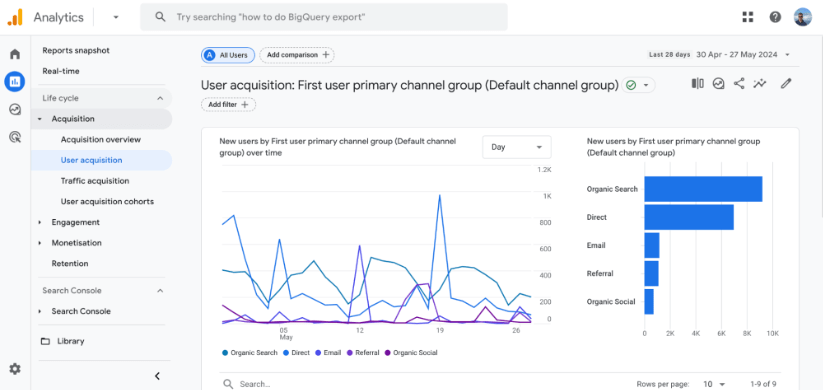
The User Acquisition report focuses on how new users are coming to your site. It details the first user interaction with your property and shows the performance of various channels in acquiring new users. Metrics in this report include new users, engagement rate, and conversion rate, segmented by acquisition source, medium, campaign, and other dimensions. This helps in understanding which channels are most effective at attracting new users.
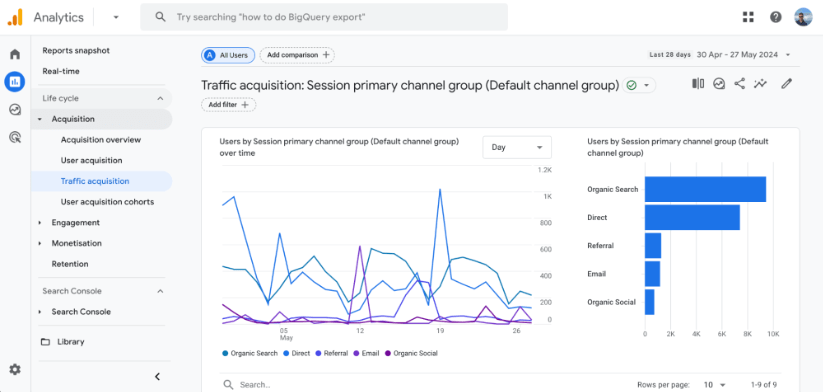
The Traffic Acquisition report provides insights into your site’s overall traffic, including new and returning users. It shows traffic sources such as organic search, paid search, social media, and referrals and includes metrics like sessions, engaged sessions, and conversions. This report helps analyze the performance of different traffic sources and understand where your most engaged users come from.
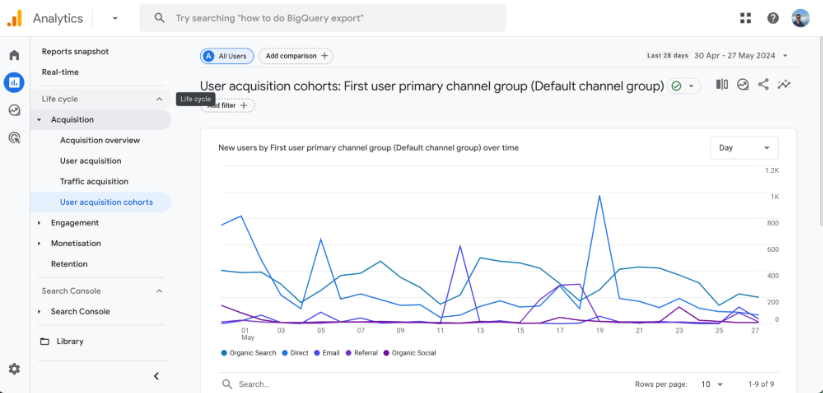
The User Acquisition Cohorts report allows you to analyze the behavior of groups of users (labeled as cohorts) based on their acquisition date. For example, you can create a cohort of users first acquired during a specific week and track their engagement, retention, and conversion over time. This report helps in understanding the long-term value of users acquired through different channels and identifying trends in user behavior across different cohorts.
Engagement Reports
The Engagement reports within GA4 focus on how users interact with your website. They include metrics like:
- Page views
- Screen views
- Session duration
- User interactions
With specific events or content, this helps you understand the quality of user engagement and also helps you identify popular content on your website.
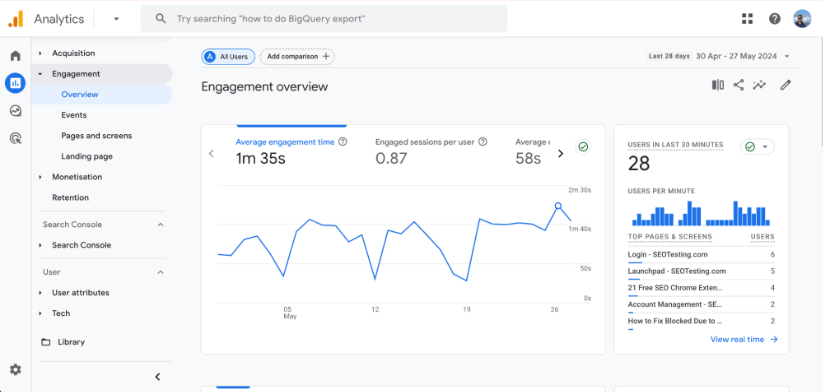
The Engagement Overview report summarises key engagement metrics on your website, including metrics like engaged sessions, average engagement time, engagement rate, and events per session. This report gives you a broad understanding of how users interact with your content, helping you identify overall engagement trends and activity levels.
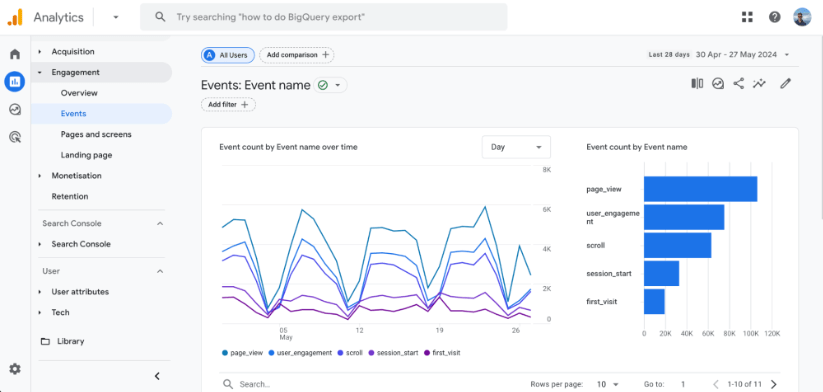
The Events report details user interactions on your site or app that you have defined as events. These can include actions like clicks, form submissions, video plays, and more. The report shows metrics such as the number of events, event count per user, and the specific events triggered. This helps you analyze the most common user actions and events contributing to your engagement goals.
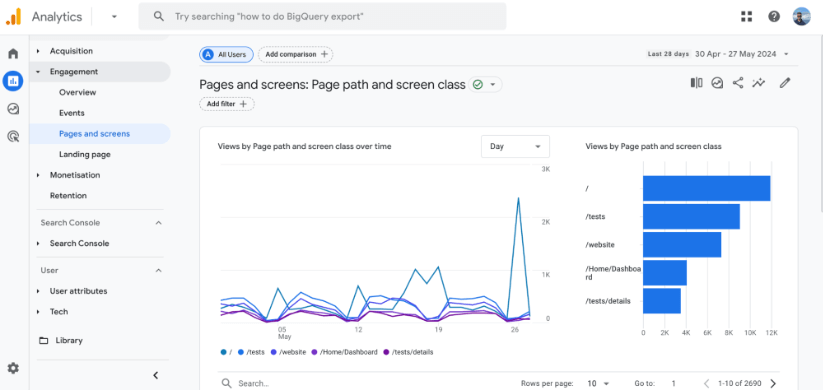
The Pages and Screens report provides insights into which pages on your website or screens in your app are most popular. It includes metrics such as views, users, average engagement time, and bounce rate for each page or screen. This report helps you understand which content is most engaging and where users spend the most time, allowing you to optimize your content strategy accordingly.
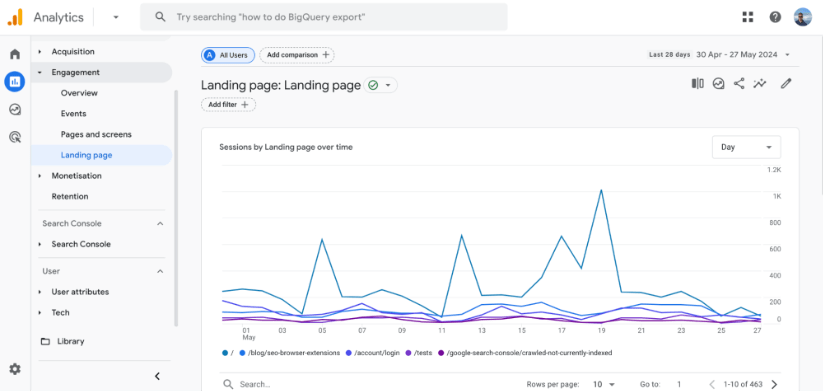
The Landing Page report focuses on the first page users see when they enter your site. It includes metrics such as sessions, new users, engagement rate, and conversions for each landing page. This report helps you identify which landing pages are most effective at capturing user interest and driving further engagement and conversions, enabling you to optimize these entry points for better performance.
Monetization Reports
The different Monetization reports within GA4 track revenue and transactions from your website. These different reports provide insights into product performance, user purchase behavior, and overall revenue generated. They help you evaluate the effectiveness of your sales strategies and identify opportunities to increase revenue.
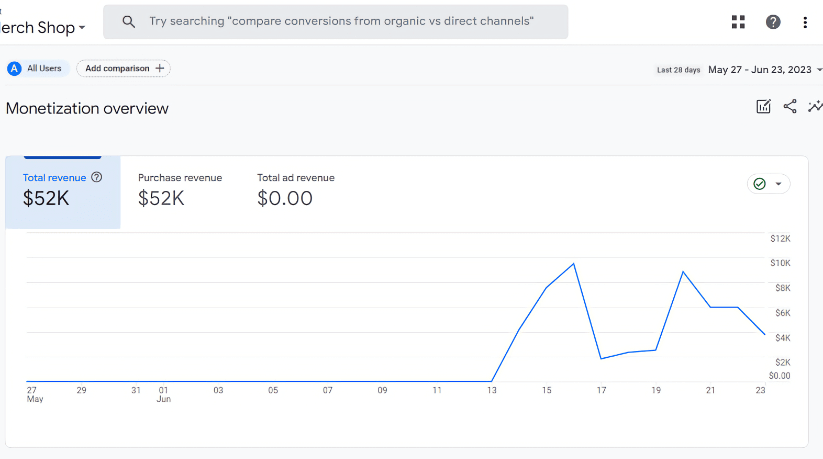
The Monetization Overview report provides a high-level summary of your revenue performance. It includes key metrics such as total revenue, purchases, average purchase revenue, and items purchased. This report offers a snapshot of your monetization efforts, helping you understand your site or app’s overall financial performance.
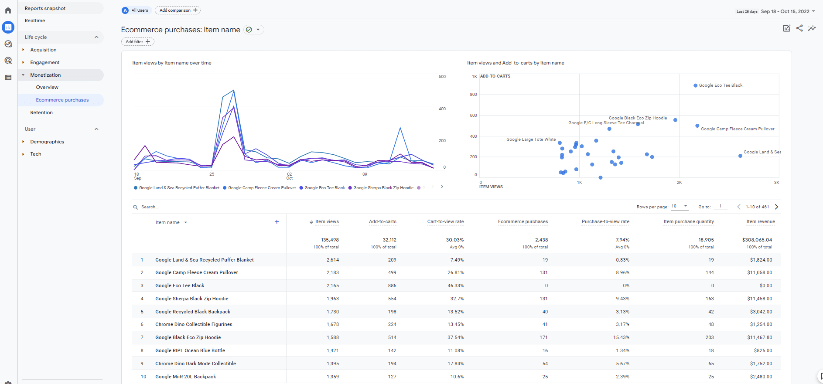
The E-commerce Purchases report gives detailed insights into the transactions made on your site or app. It includes metrics like purchase revenue, total purchases, and the number of items sold. The report also breaks down performance by product, showing which items sell the most and generate the most revenue. This helps you identify your top-performing products and optimize your e-commerce strategy.
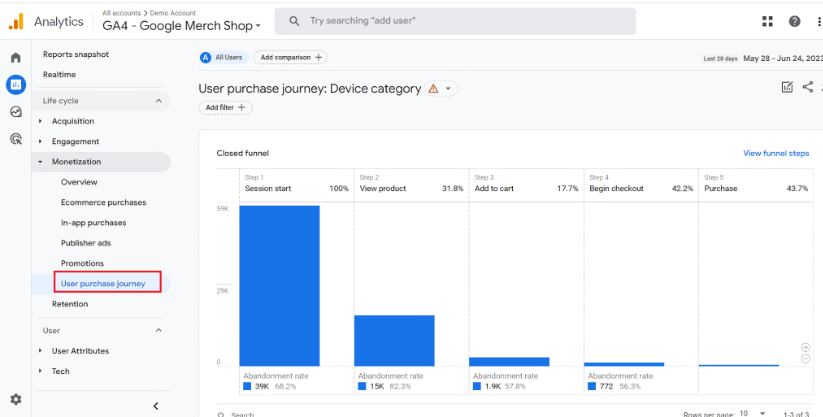
The Purchase Journey report tracks users’ initial interest in the final purchase. It includes metrics and insights on user interactions at various stages of the purchase funnel, such as product views, add-to-cart actions, and completed transactions. This report helps you understand where users might drop off in the purchase process and identify opportunities to improve the user experience and increase conversion rates.
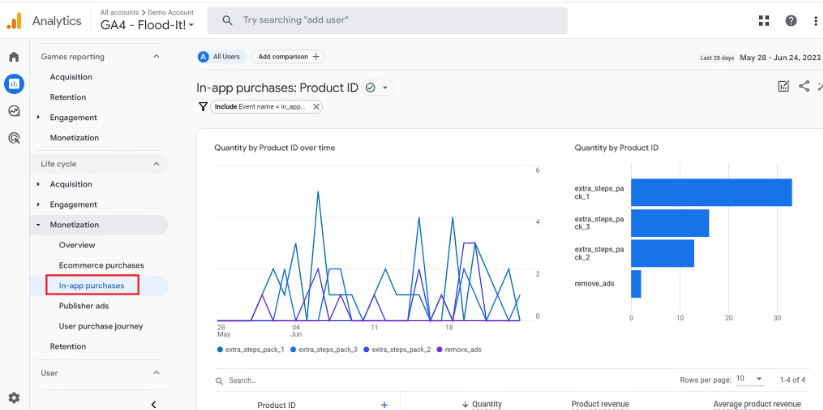
The In-app Purchases report focuses on revenue generated from purchases within your app. It includes metrics such as in-app purchase revenue, the number of in-app purchases, and average revenue per user. This report helps you understand the performance of your in-app monetization strategies and identify opportunities to increase said revenue.
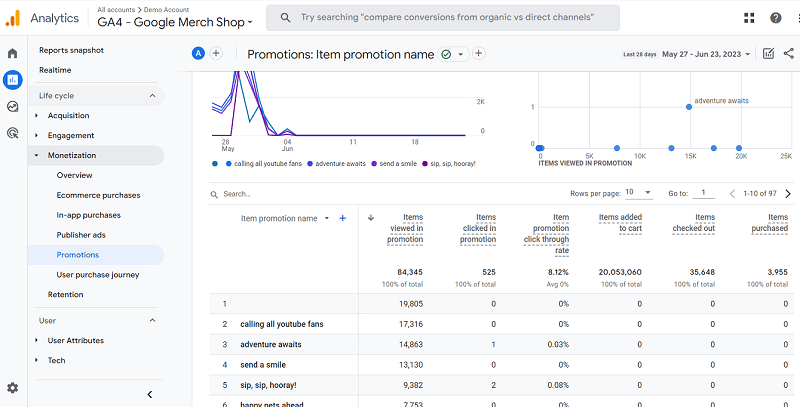
The Promotions report provides insights into the effectiveness of your promotional activities. It includes metrics such as the number of users who interacted with promotions, the conversion rate from promotions, and the revenue generated from them. This report helps you evaluate the impact of different promotional campaigns and optimize them for better performance.
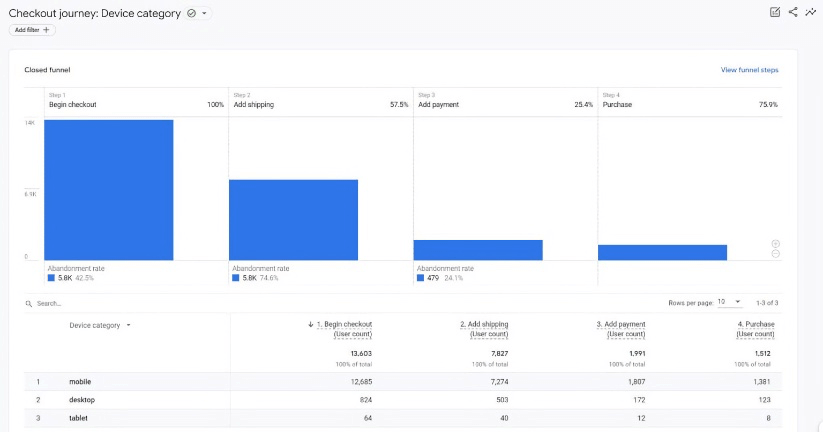
The Checkout Journey report details the steps users take during the checkout process. It includes metrics on the number of users at each checkout stage, such as cart initiation, shipping information entry, payment completion, and purchase confirmation. This report helps you identify potential bottlenecks or issues in the checkout process, allowing you to streamline and optimize the checkout experience to reduce abandonment rates and increase completed purchases.
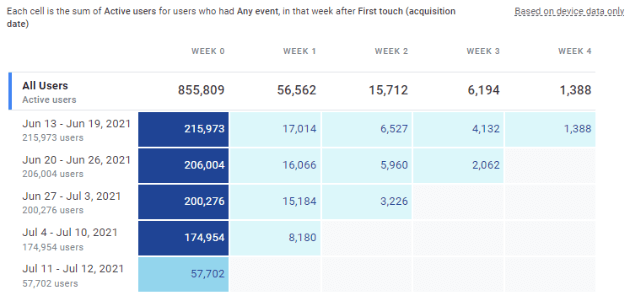
Retention Reports
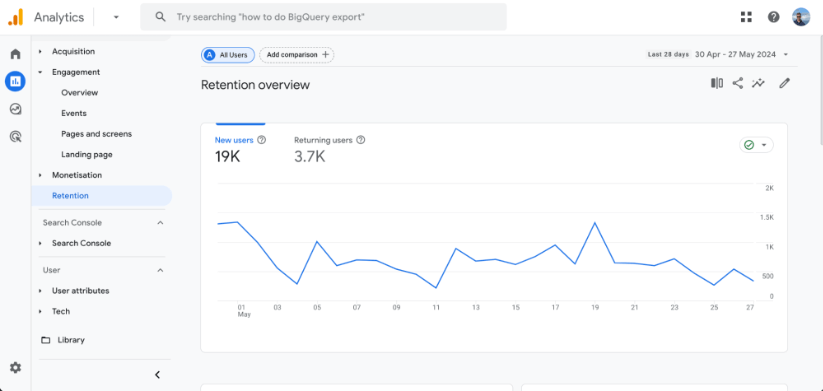
The Retention report within GA4 provides valuable insights into how well your website (or app) retains users over time. It shows your site’s retention rate, which is the percentage of users who return after their first visit, measured over different intervals such as:
- Daily
- Weekly
- Monthly
It also includes the churn rate, which indicates the percentage of users who do not return after their initial visit. This helps to highlight potential issues with user engagement.
The report includes ‘cohort analysis,’ in which users are grouped based on the date of their first session. This allows you to track and compare their behavior over time, with each cohort’s size providing context for retention and engagement metrics.
Additionally, the report covers user engagement data such as:
- Sessions
- Events
- Average Engagement Time
Which offers a deeper understanding of how retained users interact with your content.
Overall, the Retention report helps you understand user loyalty, identify when users are most likely to stop returning, and optimize the user experience to increase long-term engagement and retention.
Search Console Report
The Search Console reports within GA4 provide amazing insights into your website’s organic search performance on Google. These reports integrate data from Google Search Console, allowing you to analyze how users find your site through Google and how they interact with your content.
There are two reports within this section we need to focus on.
The ‘Queries’ report shows the search queries that lead users to your site. It includes metrics such as:
- Impressions
- Clicks
- Click-Through Rate
- Average Position
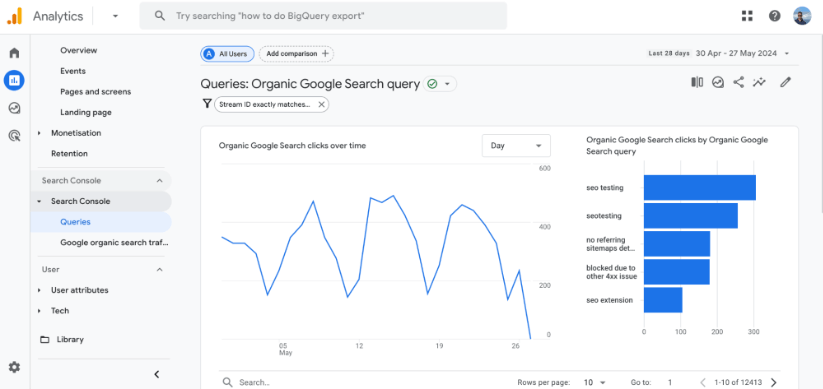
This report helps you understand which keywords drive traffic to your site and how well your content ranks in Google search results. It allows you to identify high-performing queries and opportunities for optimization quickly.
The ‘Google Organic Search Traffic’ report provides an overview of traffic coming to your site from Google’s SERPs. It includes metrics such as:
- Sessions
- Users
- New Users
- Engagement Metrics: Session duration, pages per session, and engagement rate.
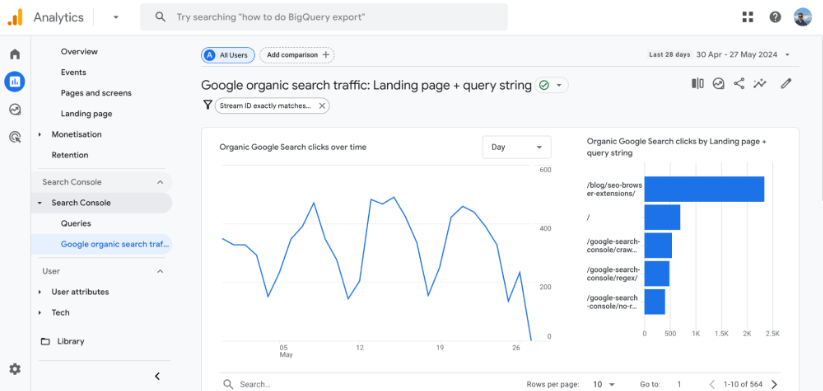
This report helps you evaluate the effectiveness of your SEO efforts by showing how much organic search traffic your site receives and how engaged these users are. It enables you to assess the overall performance of your organic search strategy and find areas for improvement.
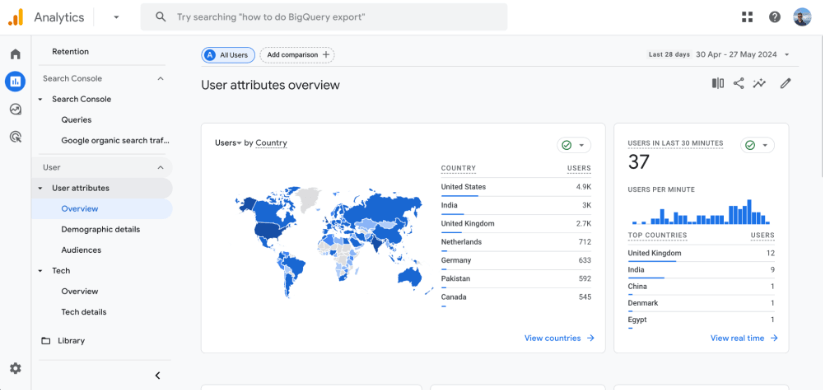
User Attributes
The User Attributes Overview report provides a high-level summary of your users’ characteristics. It includes key demographic and interest data, giving you a broad understanding of your users. This report helps you quickly identify major trends and patterns in your user base, such as age groups, gender distribution, and general interests.
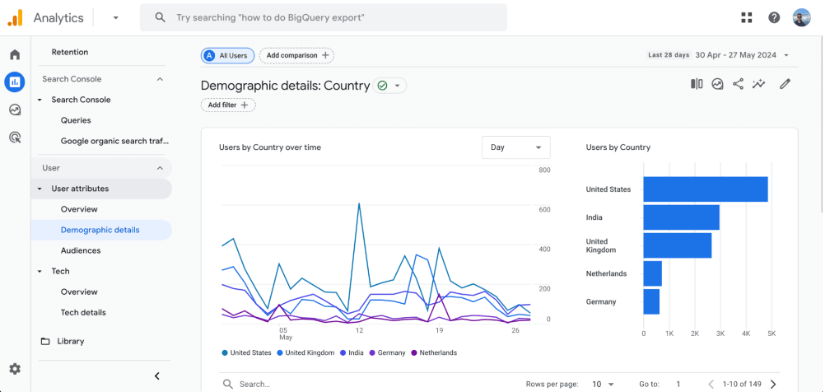
The Demographic Details report dives deeper into the specific demographic characteristics of your users. It includes detailed metrics on:
- Age: Distribution of users across different age groups.
- Gender: Breakdown of users by gender.
- Location: Geographic data showing where your users are coming from.
- Language: The primary languages spoken by your users.
This detailed view helps you understand your audience’s specific makeup, enabling you to better tailor your content and marketing strategies to meet the needs and preferences of different user segments.
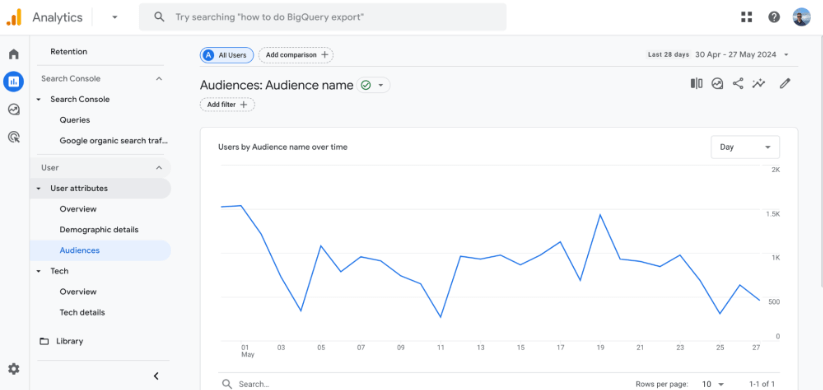
The Audiences report focuses on the predefined or custom audiences you have created within GA4. It provides insights into:
- Audience Composition: Metrics on the number of users in each audience.
- Engagement: How these audiences interact with your site or app, including engagement time, session duration, and conversion rates.
- Performance: Comparison of different audiences’ behavior and value to your business.
This report is crucial for evaluating the effectiveness of your audience targeting strategies. It will help you refine and optimize your marketing efforts to engage specific groups of users more effectively.
Tech
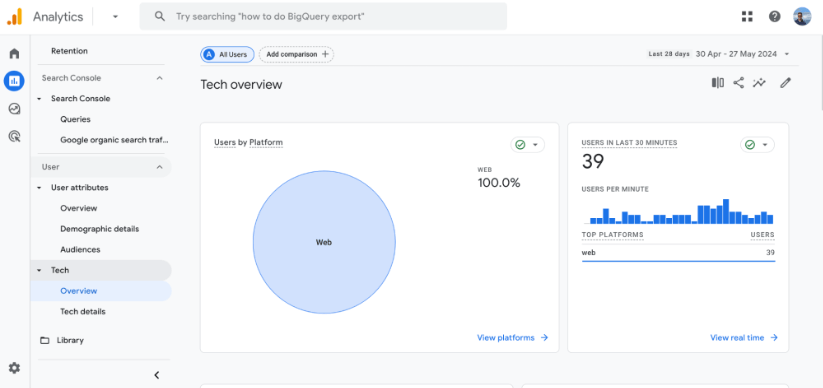
The Tech Overview Report summarizes users’ technology to access your site or app. This report includes key metrics and dimensions such as:
- Device Categories: Breakdown of users by device type (desktop, mobile, tablet).
- Operating Systems: Distribution of users across different operating systems (Windows, iOS, Android, etc.).
- Browsers: Information on which browsers users use (Chrome, Safari, Firefox, etc.).
This overview helps you understand your audience’s general technological landscape, allowing you to optimize your site or app for the most commonly used devices, operating systems, and browsers.
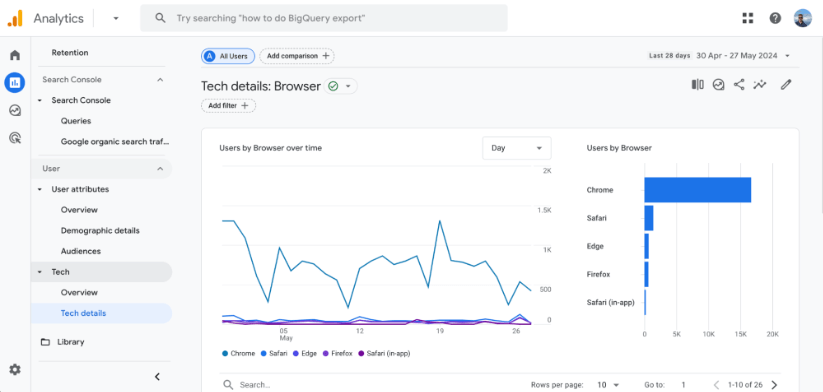
The Tech Details Report dives deeper into the specific technological configurations of your users. It provides detailed metrics on:
- Device Models: Specific devices your audience uses (e.g., iPhone 12, Samsung Galaxy S21).
- Screen Resolutions: Common screen resolutions help ensure your content displays correctly across different devices.
- Browser Versions: Detailed data on the versions of browsers users are using which can be critical for troubleshooting compatibility issues.
- Operating System Versions: Insights into which versions of operating systems are most prevalent among your users.
This detailed view helps you identify and address your audience’s specific technical needs and preferences, ensuring a smooth and optimal user experience across various devices and platforms.
These Tech reports in GA4 provide comprehensive insights into your users’ technology preferences and configurations, enabling you to make informed decisions to enhance compatibility, performance, and user satisfaction.
Explore
The ‘Explorations’ section is a powerful Google toolset allowing you to perform custom data analysis. It provides flexible report options to help you dive deeper into user behavior on your site, segment your audience, and identify trends and patterns that the standard reports within GA4 might not reveal.
With Explorations, you can create highly tailored reports to answer specific business questions and gain even more granular insights into your data to help you make better business decisions.
Blank
The Blank exploration provides a completely blank canvas to create a customized report. You can choose and configure dimensions, metrics, and visualizations according to your needs. This exploration is ideal for highly customized analyses where predefined templates do not fit your requirements.
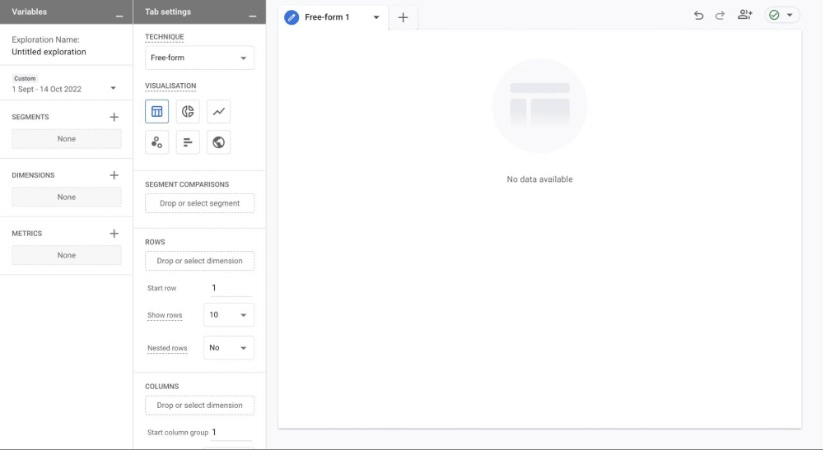
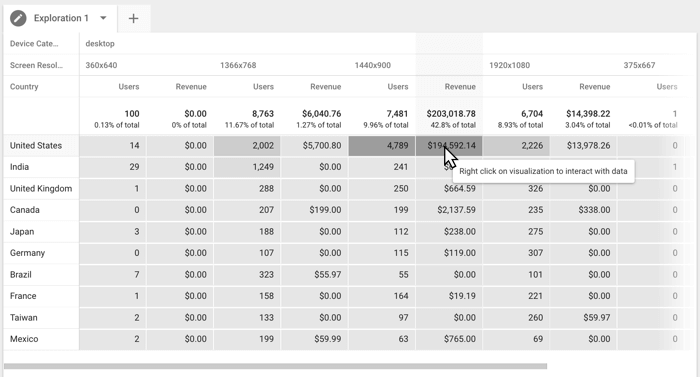
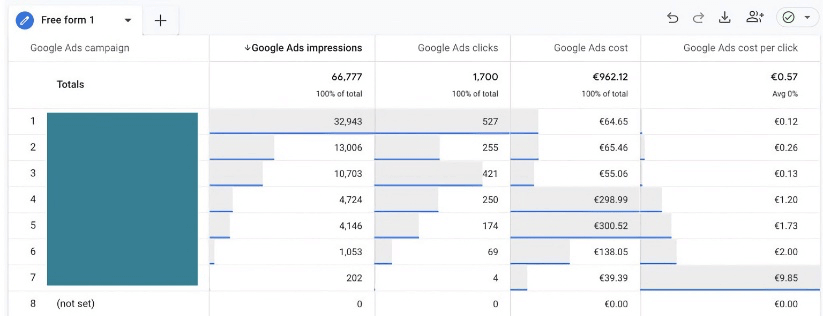
Free-form
The Free-form exploration is a flexible, drag-and-drop report builder that allows you to dynamically use tables, charts, and other visualizations to explore your data. This exploration type is great for ad hoc analysis and quick insights, enabling you to experiment with different data combinations to uncover trends and patterns.
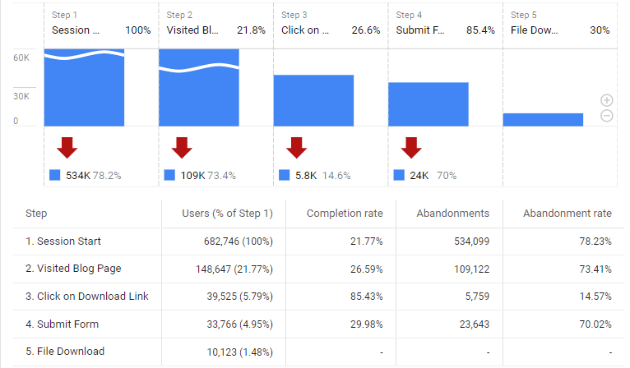
Funnel exploration
The Funnel exploration helps you analyze users’ steps to complete a process on your site or app. You can define the steps and measure drop-off rates at each stage. This exploration is particularly useful for identifying where users drop off in a conversion process, such as a checkout flow or sign-up process, allowing you to pinpoint and address potential issues.
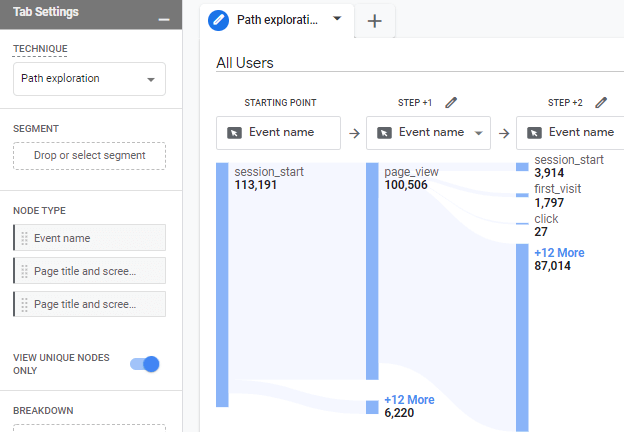
Path exploration
Path Exploration lets you visualize users’ paths through your site or app. It shows the sequence of pages or screens users visit, helping you understand their navigation patterns. This type of exploration is ideal for uncovering common user journeys, identifying potential roadblocks, and optimizing user flow to enhance the overall user experience.
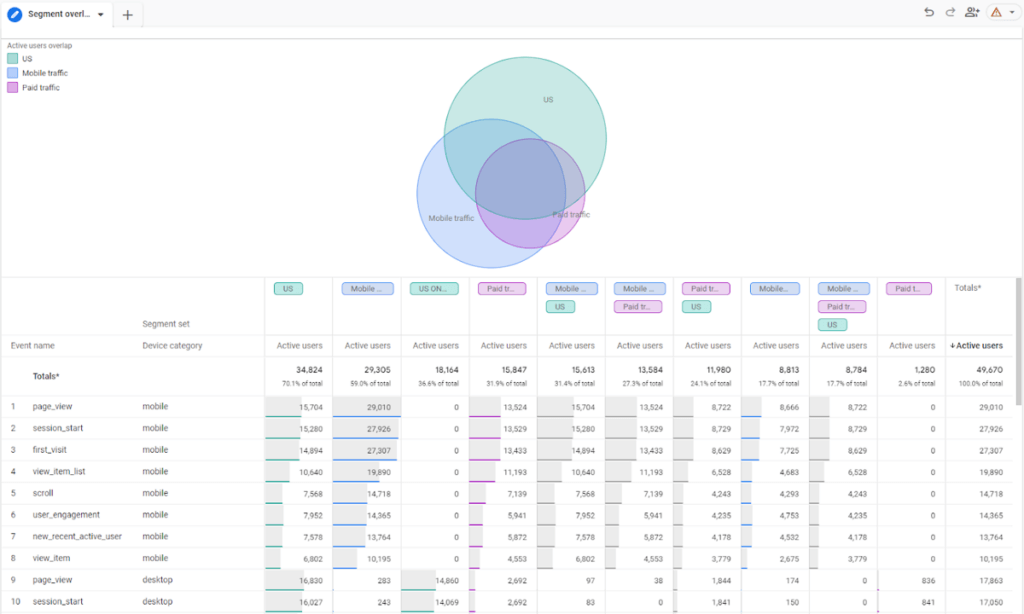
Segment overlap
The Segment Overlap exploration visualizes the overlap between different user segments. You can compare up to three segments to see how they intersect. This exploration is useful for understanding the relationships between different user groups and identifying shared characteristics, which can inform more targeted marketing and user engagement strategies.
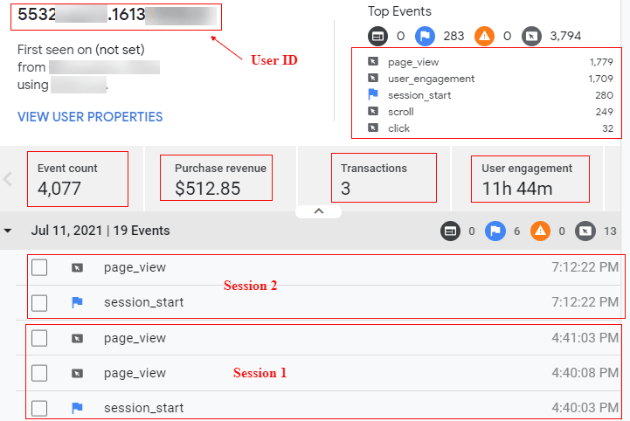
User explorer
The User Explorer provides detailed information on individual user interactions. It can show users’ specific actions, session details, and engagement over time. This exploration is best for deep-diving into individual user behaviors, troubleshooting issues, and personalized user experiences based on specific user actions and trends.
Cohort exploration
Cohort Exploration groups users based on shared characteristics or experiences within a specified timeframe. It tracks metrics such as retention and engagement over time. This exploration is excellent for analyzing user retention and understanding how user behavior changes over time based on the cohort they belong to, helping to inform retention and engagement strategies.
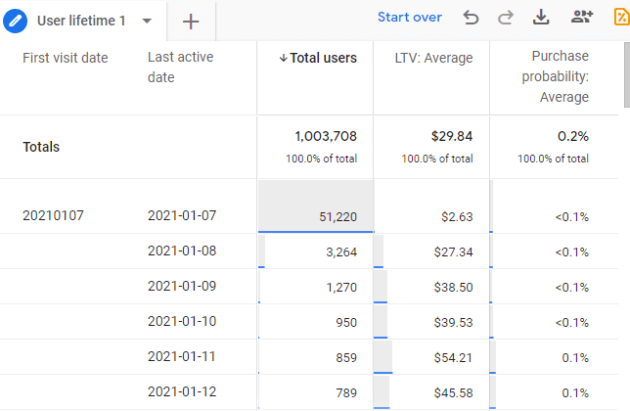
User lifetime
The User Lifetime exploration provides insights into users’ lifetime value, showing metrics such as total revenue, purchase frequency, and engagement over the user’s lifecycle. This exploration is ideal for assessing the long-term value of different user segments and informing strategies to maximize user lifetime value, ensuring sustained engagement and profitability.
Advertising
The ‘Advertising’ section of GA4 provides great insights into your advertising efforts across various platforms.
This section helps you analyze the performance of your ad campaigns, track conversions, and optimize your advertising strategies.
By integrating data from different advertising platforms, GA4 allows you to measure the effectiveness of your campaigns, understand user interactions driven by ads, and make data-driven decisions to enhance your marketing efforts.
Google Ads
The ‘Google Ads’ section provides detailed insights into your Google Ads campaigns. This includes metrics such as:
- Impressions
- Clicks
- Cost
- Conversions
- ROAS (Return On Ad Spend)
By linking your Google Ads account to GA4, you can track user behavior post-click, gaining a deeper understanding of how your ads drive engagement and conversions on your website or app. This integration helps you optimize your ad spend and improve campaign performance by showing which ads are most effective at driving valuable user interactions.
Floodlight
If you use ‘Floodlight’ tags from Campaign Manager 360, this section will interest you.
Floodlight tags help track and report conversions, providing a detailed view of your digital advertising efforts’ performance. This section lets you see which campaigns, creatives, and placements drive conversions, helping you optimize your media buys and creative strategies.
By analyzing Floodlight data within GA4, you can better understand the effectiveness of your marketing campaigns and improve ROI.
Search Ads 360
The Search Ads 360 section in GA4 provides insights into your search engine marketing campaigns managed through Search Ads 360.
This integration allows you to view metrics such as:
- Clicks
- Cost
- Conversions
- Revenue Generated
From your search ads.
It helps you track the performance of your paid search efforts across multiple search engines and understand how these campaigns contribute to your overall marketing goals.
By leveraging Search Ads 360 data in GA4, you can make more informed decisions about your search marketing strategy and optimize your campaigns for better results.
Display & Video 360
The Display & Video 360 section in GA4 offers insights into your display and video advertising campaigns managed through Display & Video 360.
This section provides metrics on impressions, clicks, conversions, and cost, allowing you to evaluate the performance of your display and video ads. It helps you understand how these ads contribute to your marketing objectives and how users interact with your site or app after viewing your ads.
Integrating Display & Video 360 data with GA4 allows you to optimize your display and video campaigns to achieve better engagement and conversion rates.
Wrapping Up
GA4 is an incredibly powerful tool for businesses seeking to maximize online success. This guide has walked you through the essential aspects of GA4, including its purpose, differences from Universal Analytics, setup process, and integration with Google Search Console. We’ve also explored the GA4 user interface and detailed the various reports available within the platform.
By leveraging GA4’s advanced analytics capabilities, you can gain deeper insights into user behavior, optimize your SEO and marketing strategies, and improve your overall user experience. The event-driven data model, cross-device tracking, and enhanced privacy features ensure access to accurate and comprehensive data while respecting user privacy.
Whether you’re analyzing user behavior, informing your SEO strategy, improving marketing campaign performance, or tracking e-commerce metrics, GA4 offers the tools and insights needed to make data-driven decisions. As you become more familiar with GA4, you’ll be better equipped to understand your audience, optimize your site or app, and ultimately drive better business outcomes.
Ready to take your SEO strategy to the next level? Sign up for SEOTesting and start your 14-day free trial today-no credit card required! With SEOTesting, you can seamlessly integrate with GA4 to track different GA4 events during your SEO tests, gaining deeper insights into your website’s performance. Don’t miss this opportunity to optimize your SEO efforts and achieve greater online success. Try SEOTesting now and see the results for yourself!
Testimonials
-

"Can totally recommend! It’s not only full of reports to easily identify low hanging fruit opportunities but also, the most straightforward platform to help run SEO tests"
Aleyda Solis, Intl SEO Consultant, Speaker & Author.
-

"SEOTesting has become one of my go-to SEO tools because it does so much with all the valuable data hidden in Google Search Console. It's the only thing that gives us the ability to use that data for keyword tracking, SEO tests, and quality testing."
Ruben Gamez, DocSketch