Google Search Console stands out as a pivotal tool for SEO experts and webmasters alike, offering deep insights into website performance in Google searches. However, navigating its many features can take time and effort, especially for beginners.
This blog post will demystify GSC, highlighting its best features and explaining how to leverage them effectively.
We’ll tackle common issues such as underutilized tools and data interpretation challenges. By the end of this post, you’ll understand how to use GSC to enhance your site’s presence in Google search, making your SEO efforts more efficient and impactful. Whether you’re a beginner or a seasoned professional, this guide will add valuable tools to your SEO arsenal.
What is Google Search Console?
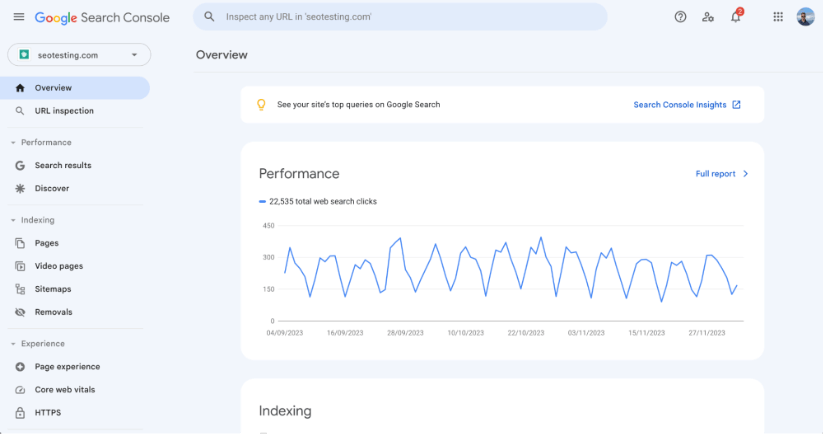
Google Search Console is a free tool offered by Google that helps SEO professionals monitor, maintain, and troubleshoot their site’s presence in Google search results. It provides insights into how Google views and indexes a website, offering important data on search traffic, performance, and technical issues.
GSC helps you to understand which queries bring users to a site, which pages are the most popular, and how a site appears in search results. It also alerts users to errors and security issues, making it an essential tool for SEO professionals.
If you want to learn more about Google Search Console, you can read our comprehensive Google Search Console introduction.
We will now dive into GSC and inform you about some of its best features and how they can improve your website’s presence within Google’s search results.
Performance Report
The Performance Report in GSC is a powerful feature that provides comprehensive insights into how your website is performing in Google search results.
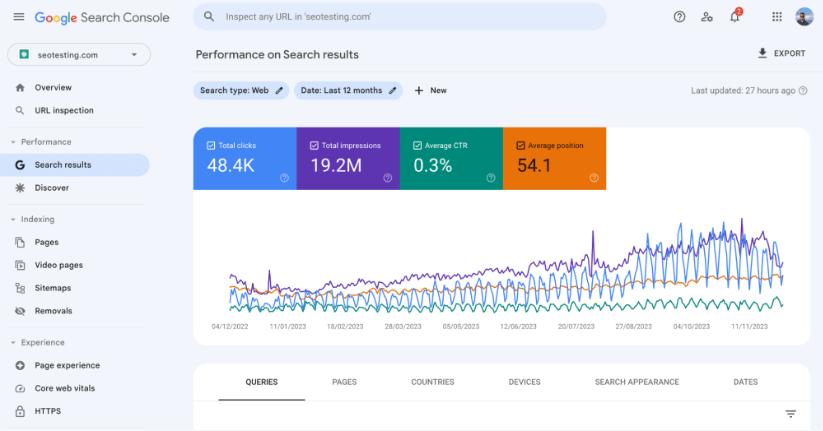
This report consists of four key components:
- Clicks: This measures the number of times users click through to your website from Google.
- Impressions: This measures the number of times your website has been seen via Google search results, whether clicked or not.
- Click-Through Rate: CTR is calculated by dividing the total number of clicks by the total number of impressions. It indicates the percentage of impressions that resulted in clicks, offering insight into how appealing your listings in Google search are to potential visitors.
- Average Position: This shows the average ranking of your website in search results for specific queries. It helps you to understand your site’s search visibility. Given Google search works in different ways in different locations, your website will appear in different positions depending on where a user is searching from, hence why you are given an ‘average’ position rather than a solid ranking.
To effectively analyse your website’s performance data within this report, it’s crucial to identify areas for improvement and where you can further understand user behaviour.
One key strategy is to address low CTR issues. If your CTR is low, it may indicate that your titles or meta descriptions must be more compelling or relevant to the search queries. Try experimenting with more engaging, keyword-rich titles and descriptions to combat this.
Additionally, it’s vital to identify missing keywords. Check for queries where your site appears in search results but doesn’t receive clicks. These instances could provide opportunities to optimise your content or meta tags for those keywords.
Another practical approach is to look for patterns in clicks and impressions. Identify which pages and queries are performing well, and use these insights to guide further and optimise your content strategy.
Understanding the trends and patterns in your performance report is vital for tailoring your SEO strategy to achieve better results.
URL Inspection Tool
The URL Inspection Tool within Google Search Console offers a detailed look at how Google and its bots view a specific URL on your website. It’s an invaluable resource for SEO as it provides critical insights about the indexing status and visibility of pages on your website.
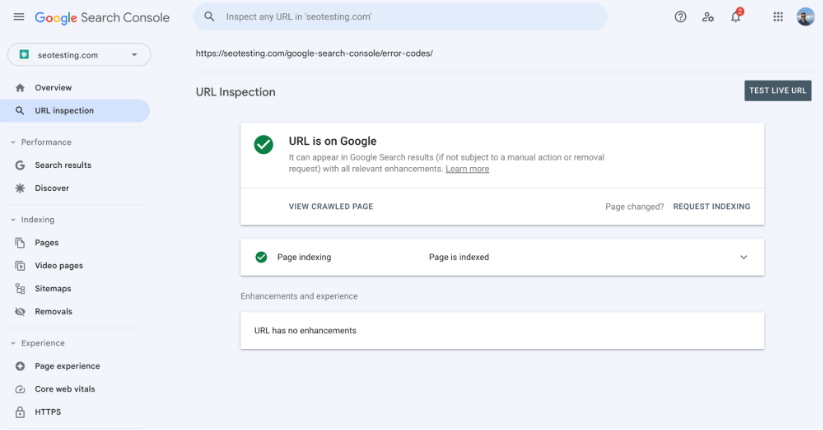
When you enter a URL into the tool, it gives you a wealth of information. Including:
- Indexing Status: This shows whether the page is indexed by Google. If the page is not indexed, it provides reasons why and tips on how to get the page indexed.
- Crawl Information: Details when Google last crawled the page, the crawl status, and any errors encountered during the crawl.
- Mobile Usability: Indicates if the page is mobile-friendly, which is crucial for ranking well in mobile search results.
- AMP Status: For websites that use AMP, it displays AMP pages’ validation and indexing status.
- Structured Data Information: Shows whether structured data (like Schema markup) on the page is correctly implemented and whether Google can accurately process it without issue.
The URL Inspection Tool is an essential tool for SEO for various reasons. One of its primary functions is diagnosing indexing issues. Understanding why Google does not index a page is critical in addressing any visibility issues on your website. This tool pinpoints problems, such as crawl errors or incorrect noindex tags.
Additionally, it plays a vital role in monitoring page updates. After updating content or fixing SEO issues on a page, you can use this tool to ask Google to re-crawl it, which aids in getting your content indexed faster.
Another crucial aspect of this tool is its ability to help you optimise pages for mobile and AMP. With mobile SEO being a vital cornerstone of successful SEO strategies, ensuring that your pages are mobile-friendly and AMP-compliant (if needed) is essential to ranking well in mobile search results.
Lastly, the URL Inspection Tool is invaluable for validating structured data. The correct implementation of structured data will not only enhance your content’s appearance in search results, like rich snippets, and ensure it meets Google’s guidelines.
Regular use of the URL Inspection Tool to inspect URLs guarantees (when done correctly) that your pages are indexed and optimised for the best possible performance in Google Search.
Page Indexing Report
The Page Indexing Report provides a comprehensive overview of how Google is indexing pages on your website.
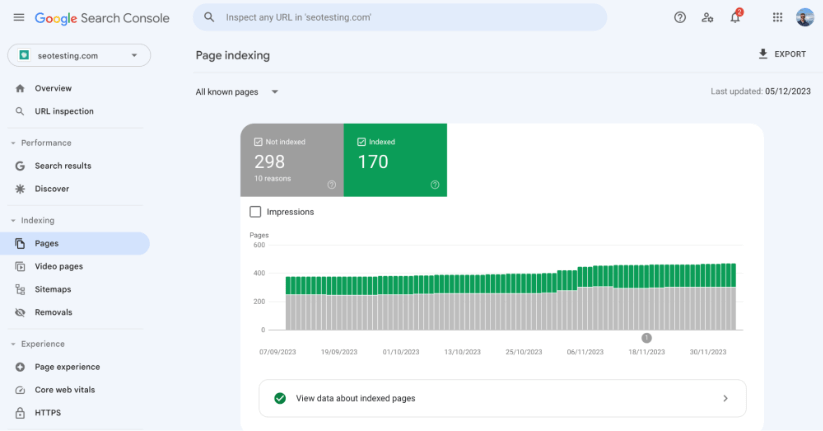
This report is crucial for website owners and SEO professionals because it reveals the indexing status of individual pages, helping you uncover potential issues that might impact a site’s visibility in Google and other search engines, although this is an indirect benefit.
The report categorises pages into different statuses, including:
- Indexed: Pages that are successfully indexed by Google and appear in search.
- Crawled – Currently Not Indexed: Pages crawled by Google but have yet to be indexed.
- Discovered – Currently Not Indexed: Pages that Google knows about but hasn’t crawled yet.
- Excluded by ‘noindex’ tag: Pages that are intentionally not indexed due to a noindex tag.
- Blocked by robots.txt: Pages are blocked from crawling by the robots.txt file.
Each status provides critical information into the indexation process and helps identify areas on your website that require further attention.
There are a lot more coverage report statuses to know about. Find out more with our article on Google Search Console error codes.
Engaging in a few good practices is essential to utilise the Page Indexing Report in GSC effectively. First, identify non-indexed pages by looking for your site’s “money” pages listed under status such as Crawled – Currently Not Indexed or Discovered – Currently Not Indexed. Investigating why these pages aren’t indexed is crucial, and taking corrective actions, including improving content quality or resolving crawl issues, is vital.
Additionally, reviewing the pages marked under the Excluded status is wise to confirm they are not being indexed intentionally. Sometimes, pages that should be indexed might accidentally be tagged with a noindex tag or be blocked by your site’s robots.txt file.
Another good practice is to monitor changes over time. Regularly reviewing the report will help track changes in the indexing status of your pages, giving insight into how recent updates or modifications to your site are impacting indexing.
Lastly, optimising for better indexing is essential. Using the insights from the report to improve your website’s structure, content, and overall SEO strategy, aiming to ensure more of your pages are effectively indexed.
Sitemaps Report
The Sitemaps Report in Google Search Console is a critical tool for website owners and SEO professionals, offering a detailed overview of how Google interacts with the sitemap (or sitemaps) submitted for a website.
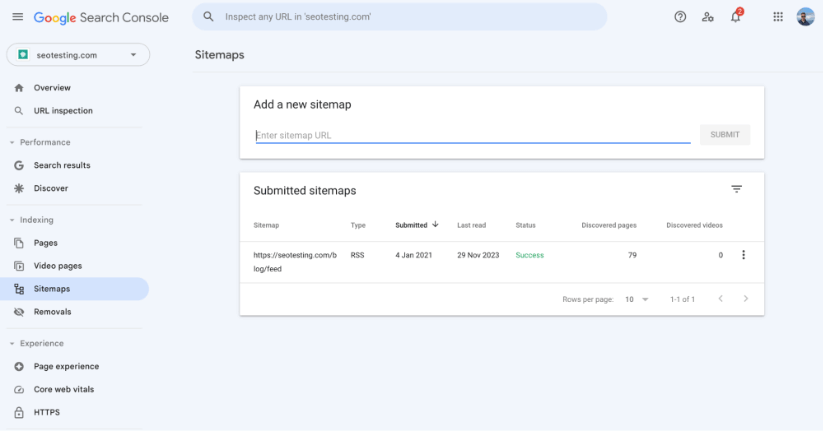
Sitemaps are essential for SEO as they guide search engines through the content available on your site, ensuring that all vital pages are discovered and indexed correctly.
The Sitemaps Report provides handy information on:
- Sitemaps submitted: Displays all the sitemaps you have submitted to Google, along with their submission dates.
- Last read date: Indicates the last time Google accessed a particular sitemap. This helps in understanding the frequency of Google’s interactions with your sitemap.
- Status: Shows whether the sitemap was successfully processed or if there were any issues.
- Discovered URLs: Shows whether the sitemap was successfully processed or if there were any issues.
Here are some of the best use cases for the Sitemaps Report in Google Search Console:
Ensuring Complete Indexing: By reviewing the number of URLs discovered in your sitemap and comparing it with the number of pages you expect to be indexed, you can identify any gaps in your site’s indexing status. This helps you ensure that all your important pages are known to Google.
Tracking Sitemap Processing: Monitoring the last read date and status of your sitemaps lets you know how often Google is crawling your sitemap and if any errors during the processing phase require your attention.
Updating Content & Sitemaps: Whenever significant updates are made to your site, such as adding new content or removing outdated pages, it’s vital to update your sitemaps accordingly. The Sitemaps Report can then be used to confirm that Google has acknowledged these updates and taken appropriate action.
Identifying & Fixing Errors: If there are issues with your sitemap, such as URLs that Google couldn’t crawl or process, the report will show this. This allows you to make necessary corrections to ensure your site is indexed as efficiently.
Page Experience Report
The Page Experience Report in GSC offers insight into how users experience and interact with a web page beyond its pure informational value. This report is essential for understanding and enhancing the user experience on your website, which is a crucial aspect of modern SEO practices.
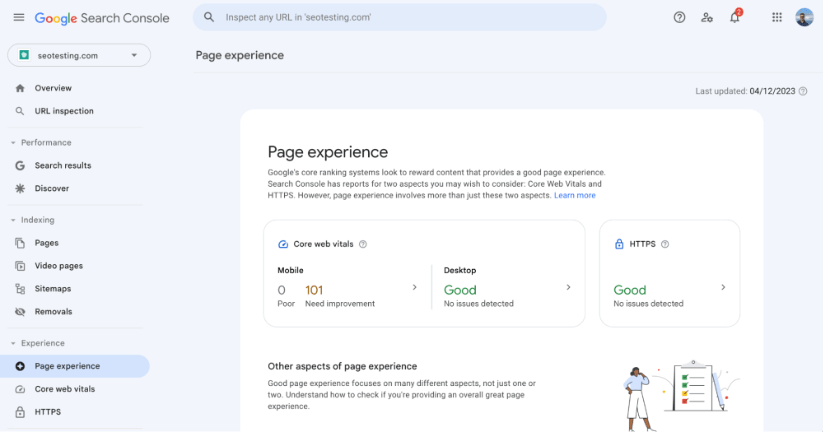
This report evaluates sets of signals that Google considers critical for users to have a good experience on your website, such as:
- Mobile-friendliness.
- Safe browsing.
- HTTPS security.
- The absence of intrusive interstitials.
A key focus of this report is on Core Web Vitals, which are metrics that measure the real-world experience of users in terms of loading performance, interactivity, and visual stability of the page. These metrics include:
- Largest Contentful Paint, which measures loading performance.
- First Input Delay, which gauges interactivity.
- Cumulative Layout Shift, assessing the visual stability of your site.
For SEOs, the Page Experience Report is invaluable as it directly ties into Google’s emphasis on user experience as a ranking factor. By analysing this report, SEO professionals can pinpoint areas where their site might fail to provide a positive user experience. This enables them to make targeted improvements. For instance, if a site is not scoring well on LCP, it indicates that its loading times need to be optimised, perhaps by reducing the size of large images or streamlining the delivery of CSS and JavaScript.
Wrapping Up
In conclusion, Google Search Console’s diverse features, including the Performance Report, URL Inspection Tool, Page Indexing Report, Sitemaps Report, and Page Experience Report, offer invaluable insights for any SEO strategy.
From detailed performance metrics to crucial indexing and user experience information, these tools comprehensively view a site’s presence and performance in Google search. By effectively leveraging these features, webmasters and SEO professionals can identify and rectify issues and enhance their site’s overall search visibility and user experience.
This guide has aimed to demystify the intricacies of these features, offering practical tips to harness their full potential, ensuring that your website stands out in the ever-competitive landscape of online search.
If you want to make more use of the data that Google Search Console provides, give SEOTesting a try! We take your GSC data and put it into helpful reports to help you increase traffic to your site and make SEO testing simple and quick. We have a 14-day free trial, with no credit card required.

