Whilst there are several brilliant keyword research tools out there, such as Ahrefs and Keyword Surfer, there is one tool you may be missing from your stack, one that you may already be using on a daily basis.
In this article, we will talk you through how to use Google Search Console for keyword research. We will explain how to find keyword opportunities, how to optimise single pages as well as how to find branded keywords. All within Search Console itself.
Find Keyword Opportunities
First, we're going to look at how Google Search Console can be used to find keyword opportunities within your existing content.
Open the Performance Report
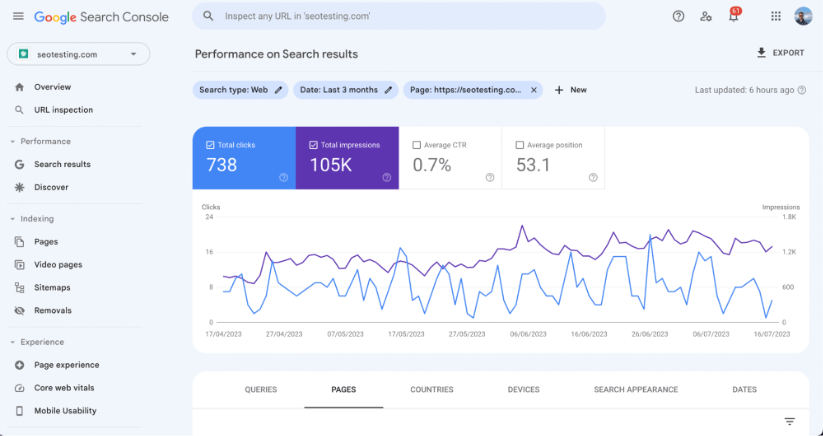
You are first going to open up your Performance report. This will be located in the navigation bar on the left-hand side of your screen, nested under the 'Performance' tab.
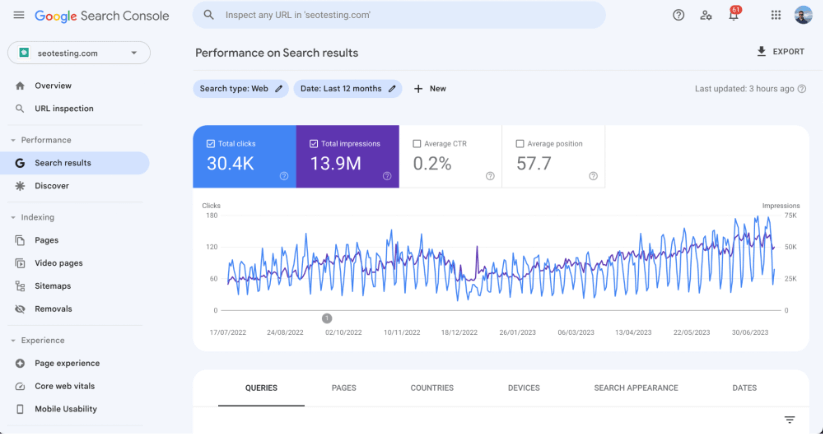
This report will show your search performance as a whole, including:
- Clicks
- Impressions
- Average CTR
- Average position
It will also show:
- Your queries with the most clicks and impressions.
- Your pages with the most clicks and impressions.
- The countries you are showing up in the most.
- How your traffic is split up across different devices like desktop, mobile and tablet.
As well as showing you how you appear in search and your daily impressions and clicks.
Choose the Date Range for your Data
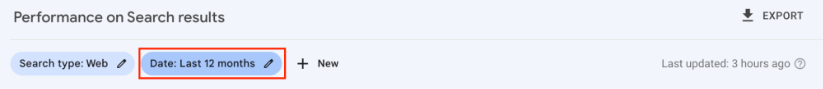
We now need to select the date range that we'd like to see our keyword data for. We'd recommend choosing 12 or 16 months if you have this amount of data available. It is worth noting at this point that Google Search Console only stores data for 16 months, so any data up to this point will be lost unless you have archived it before.
You can select the date range you'd like to see at the top of your Performance report. For this example, we have selected to have 12 months worth of data.
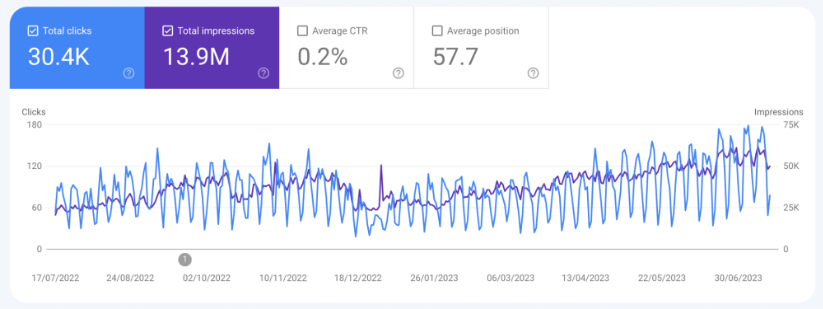
Once you have selected your date range, you should now see a graph showing the daily clicks and impressions for this time period.
Export your Data into a Spreadsheet
We now need to export this data.
At the very top of your Performance report, in the top right-hand corner of your screen, you will see a button that says "Export". This is where you need to click.
You will have the option of exporting your data as a Google Sheets file, a Microsoft Excel file or a CSV file.
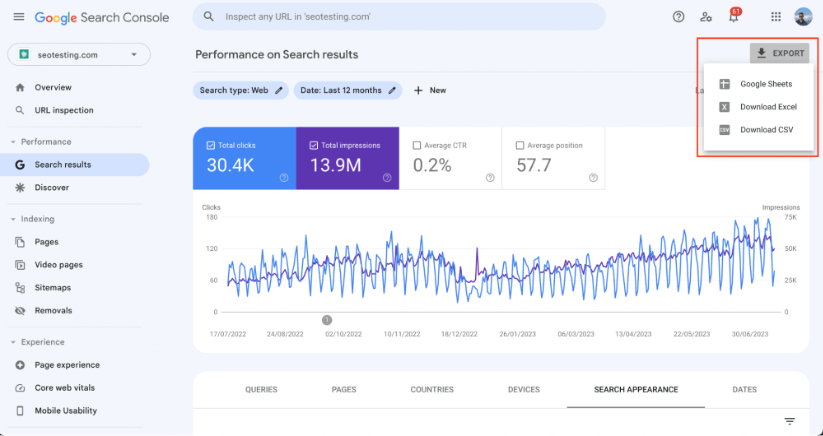
For this example, we will be using Google Sheets, but the process is extremely similar even if you choose to download as a Microsoft Excel file or a CSV file.
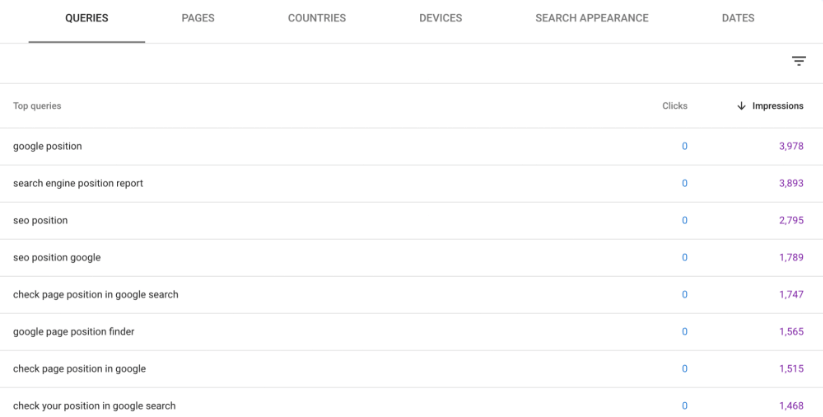
Now we have downloaded the data, we can see our data in a spreadsheet format. By default, the "Queries" tab will open up first. This is the main tab that we will be focussing on.
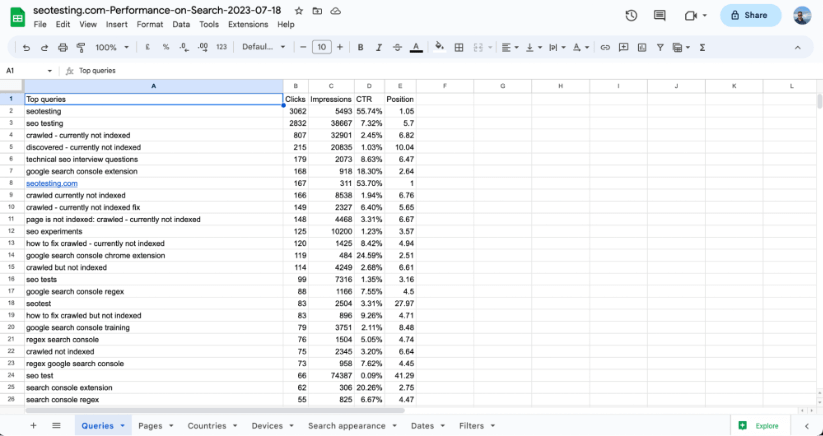
This shows all your query data.
You can see the query your website is ranking for as well as the number of clicks, impressions, the CTR of that particular query and the average position. This is all taken from the date range we selected earlier, so the screenshot above shows data for the last 12 months.
Add a Filter
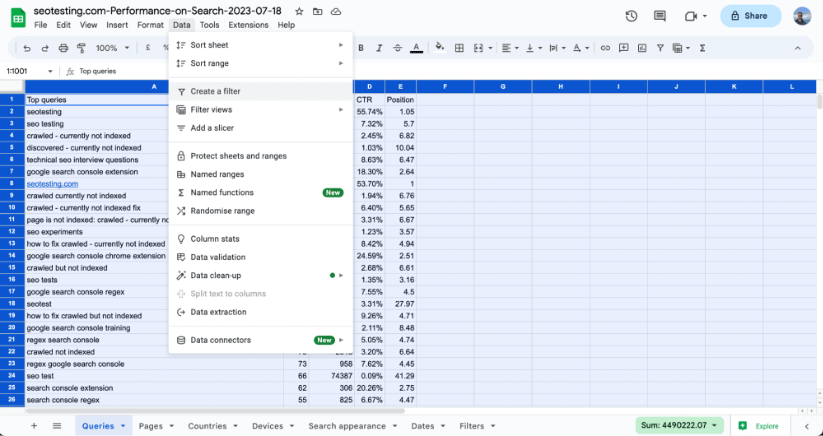
We now need to add a filter to this data to make it easier for us to navigate.
If you're working in Google Sheets, select all the data, navigate to the Data tab and then select the "Create a filter" option.
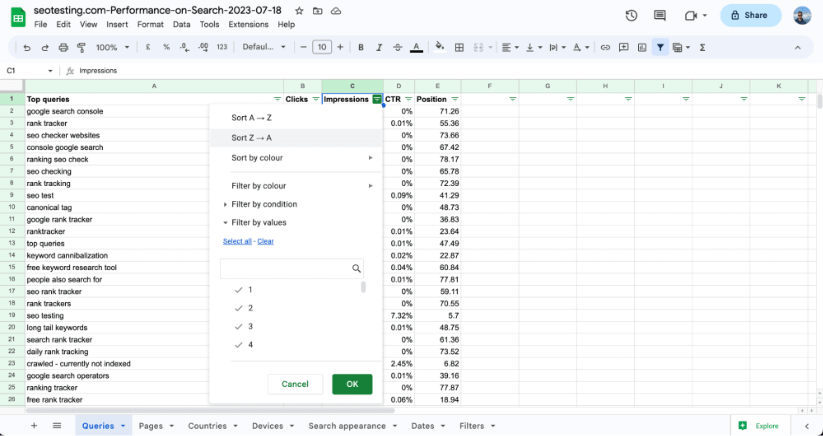
We're now going to sort our queries from highest impressions to lowest.
To do this, select the impression column that we've just added a filter for and select "Sort Z → A". This will show the query with the largest number of impressions first and the lowest number of impressions last:
Find your Page One Rankings
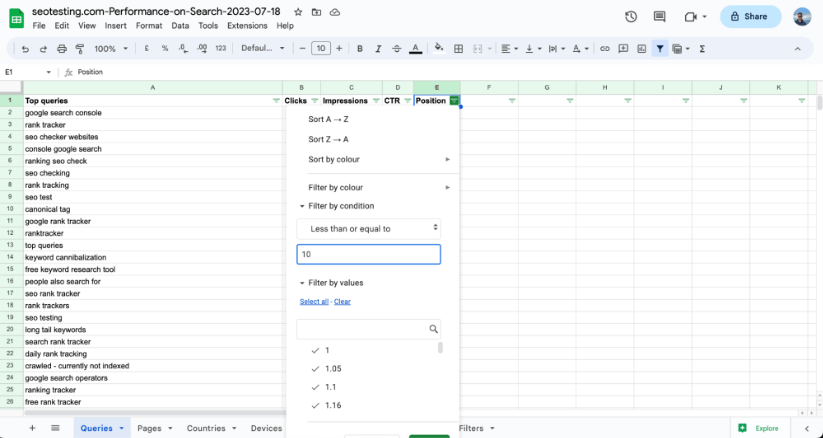
We now need to find all the keywords that are ranking on page one. These are keywords that Google is already ranking, and ranking well. We need to make sure we are continually optimising these, hence the reasoning for finding them now.
To do this, select the position column and click the filter. We now need to filter by condition, and filter it so it only shows numbers less than or equal to 10.
You are now going to highlight all of the keywords relevant to your business that you are not actively targeting within your SEO campaigns. Focus on keywords already generating a lot of impressions. You can then add these keywords into blog posts, add internal links etc to help generate more traffic for these specific queries.
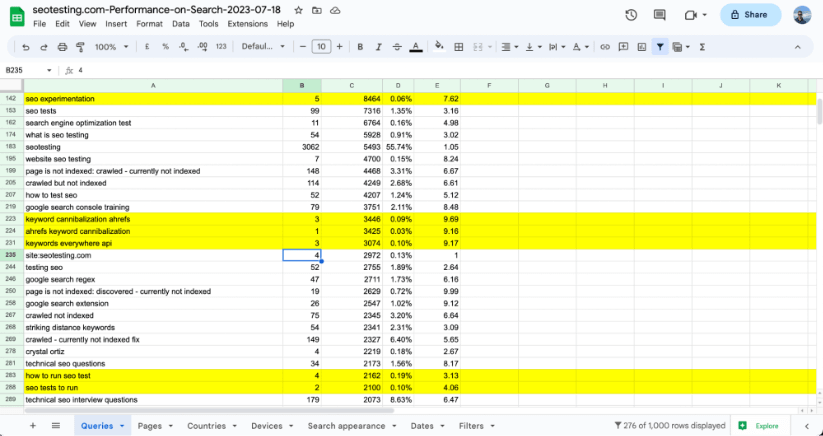
You can do the same for queries that are not currently ranking on page one, but we would recommend going through this process and find all of your current page one rankings that you are not actively targeting as this is a good "quick win" for your business.
As you can see from the screenshot above, there are a few keywords we are generating a lot of impressions for but not so many clicks. If we can create content based around these keywords, we have a great opportunity to create more relevant clicks to our website.
Bonus Tip: Find your Quick Win Keywords
You can do a very similar thing with the position filter to find quick win keywords for your website.
Simply head back to the filter, filter by condition and ask it to filter any number between 10 and 20.
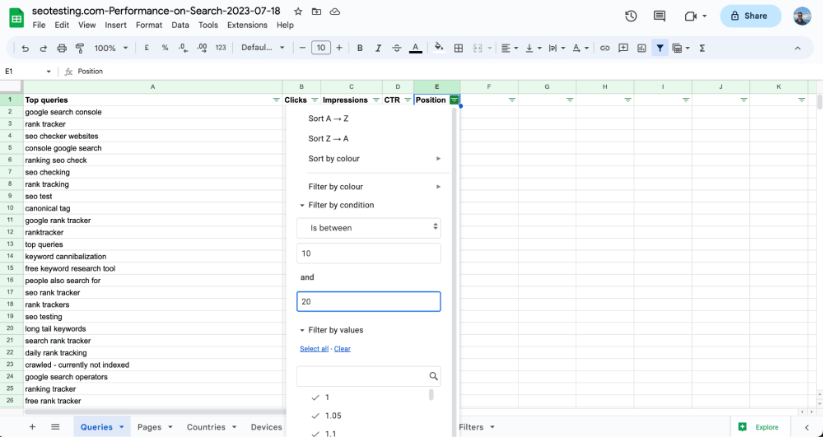
This will show you all of your keywords ranking, on average, on page two of Google.
Working on these queries will be a great quick win for your business if you can get your website showing on page one for any of these queries. Impressions and clicks are sure to go up.
Looking for an even quicker way to do this? SEOTesting can help. Our "Striking Distance Keywords" report will automatically find all of your queries that are ranking on page two of Google and place it into an easy to read and understand report.
How to Optimise Single Pages in Google Search Console
You can also use Google Search Console to optimise one page at a time.
First, open up your performance report within Google Search Console, as we did earlier.
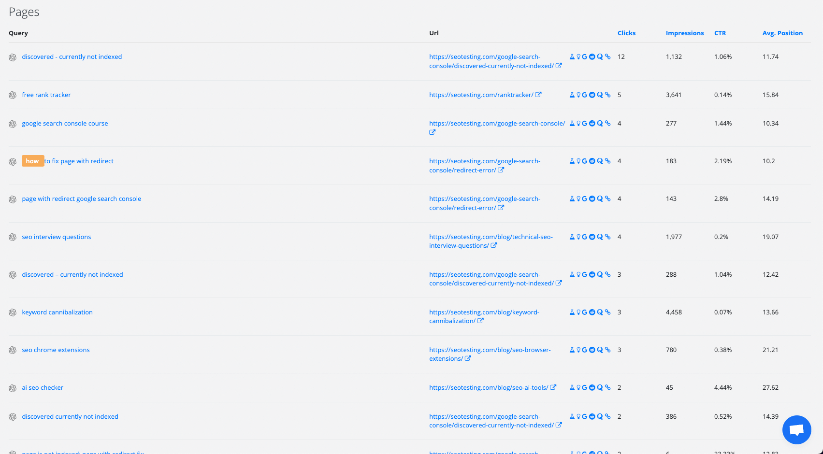
You will then want to scroll down and click on the "pages" tab that shows up just underneath your performance graph.

Don't see the page you want to optimise on this list? Don't worry, you can filter the list and find the URL that you want to optimise. Click on the filter icon, shown highlighted in the screenshot above.
Once you have clicked on the filter icon, select the "Top pages" check box.
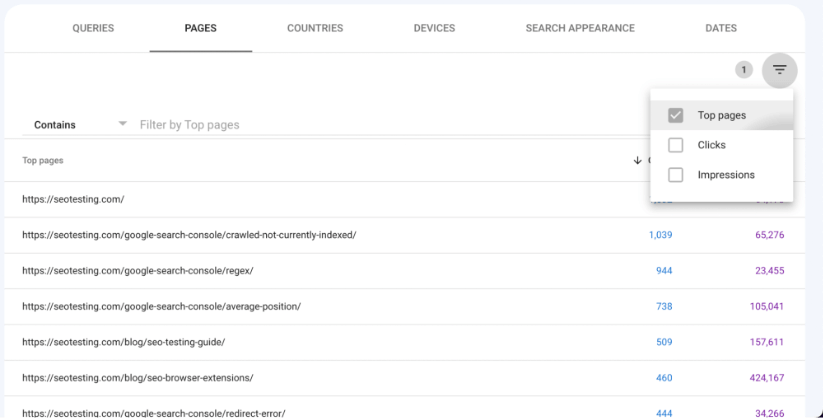
You will see a search box appear once you have clicked this filter. From here, you can find the URL you wish to optimise using the "Contains" filter.
For this example, we've searched for any URLs containing google-search-console within the URL. This will bring up all the URLs getting impressions and/or clicks for this topic hub we are building out.
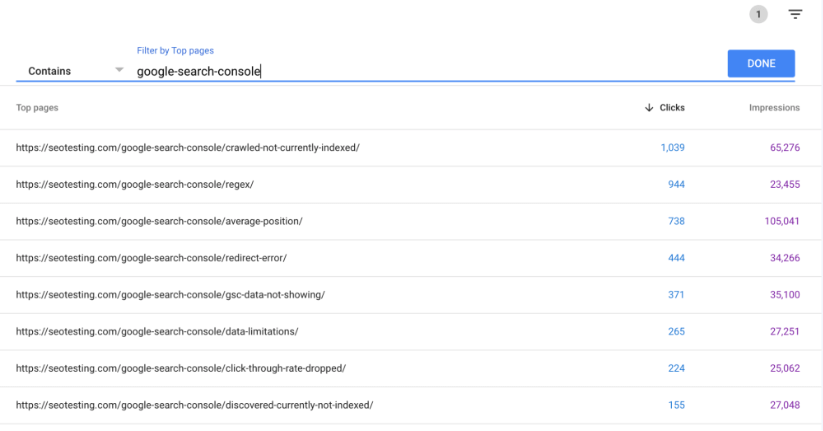
Looking at the screenshot above, we can see our piece on average position is getting 105,000 impressions but less than 1,000 clicks. This is a good one for us to optimise.
Click onto this URL and you will be taken to the performance report, this time filtered to only show the clicks and impressions for that specific URL.
Scroll down from this and select the "Queries" tab. This will show you all of the queries that this URL is getting impressions and/or clicks from.
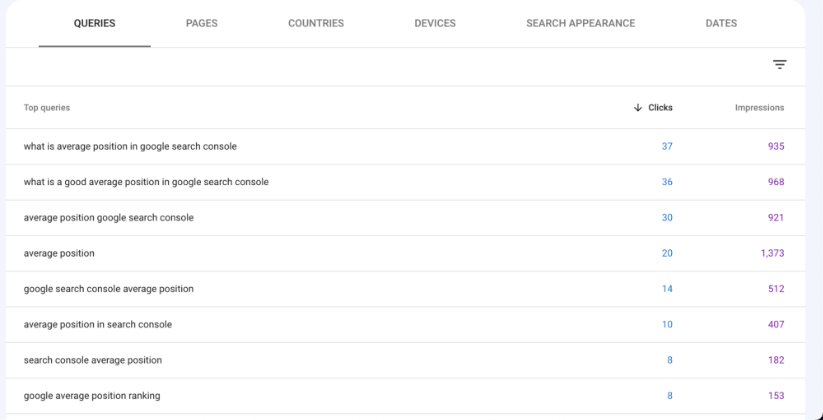
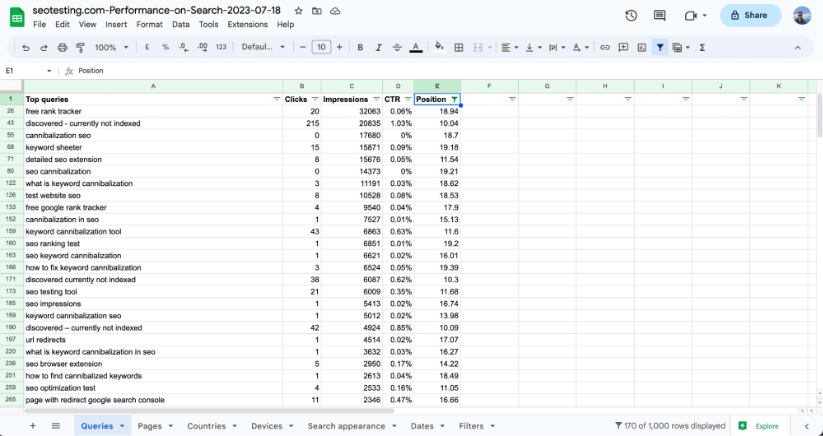
Once you have this list, you can sort it by impressions. We want this list filtered so it is showing the queries with the highest number of impressions first:
As you can see here, there are lots of queries here getting lots of impressions but no clicks.
We should think now about adding these queries into the page content, and maybe even the page title and meta description if it makes sense to do so. This will help Google see extra value in these queries and, hopefully, rank our URL higher for these queries.
Find your Branded Keywords in Google Search Console
Through all of your keyword research, it is also worth researching how your brand is found within search. This is very easy to do.
Head right back to your performance report:
Where you can see the filters for search type and date, click on "New" to add a new filter.
Select "Query" within the filter section and then click on "Compare". This is the section needed to compare two things against each other. You can do this to find the performance comparisons of different pages, but in this instance, we are comparing the performance between queries containing our brand keyword, SEOTesting, and queries that do not contain our brand keyword.
Here is what we are inputting to do this:
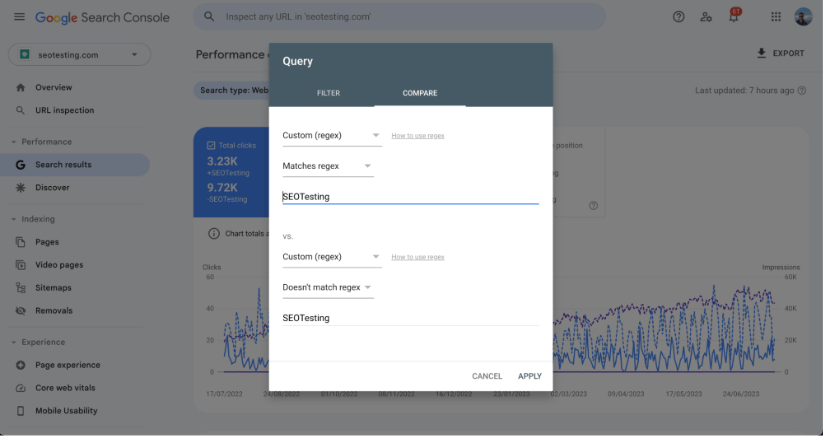
Once we have inputted this, you will see a direct comparison between your search performance for your brand term and your search performance excluding your brand term:
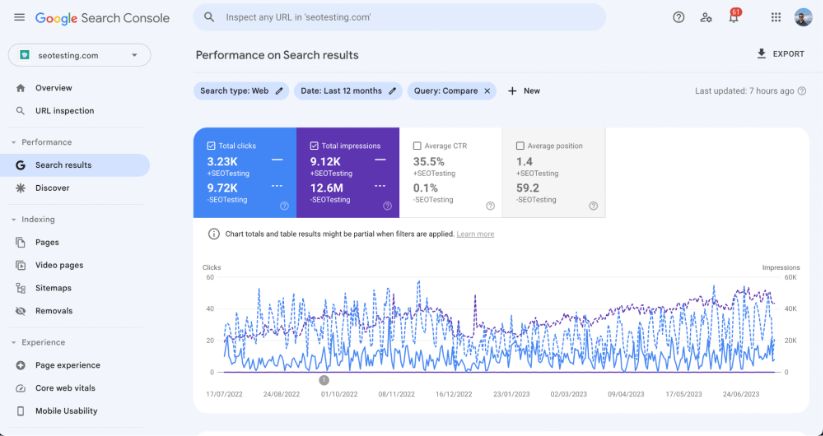
This will be useful when analysing the results of brand-based PR campaigns, whether in-house or from an external agency. It will also be useful when analysing your performance following core updates, as these tend to impact non-brand traffic but leave brand traffic unaffected.
Looking at our data. We can see that approximately 3,200 clicks in the last 12 months have come from brand-based queries and approximately 9,700 clicks have come from queries which do not contain our brand keyword at all.
We can use the peaks and valleys within the graph to determine how we are doing over time. As we can see, non-brand impressions and clicks have been slowly rising over the past 6 months which shows we are doing well with our SEO campaigns.
Want a quicker way to do this? We've built the Brand vs Non-Brand Report in SEOTesting to do just this.
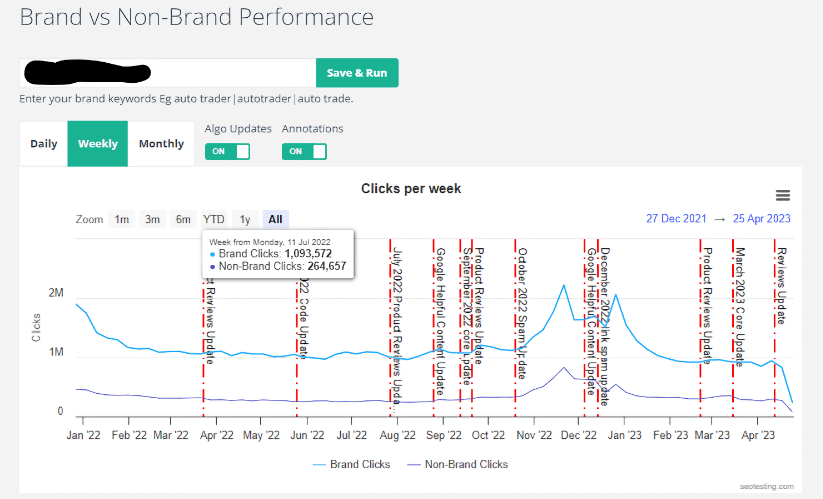
With this report, we do all of the Regex filtering for you and you don't have to lift a finger. All you need to do is enter your brand keywords and run the report. You will then be able to see the following information:
- Clicks per week
- Impressions per week
- Average position per week
- Average CTR per week
Split out across different time periods.
There you have it, three different ways to do keyword research within Google Search Console. Hopefully this has helped you learn more about how you can optimise individual pages, find quick win opportunities and learn more about your brand presence, all without leaving Search Console itself.
If you want to supercharge your use of Google Search Console data, consider giving SEOTesting a try. We take all the hard work out of using Search Console and its data. We are currently offering a 14-day free trial with no credit card. Sign up for your free trial here.
Testimonials
-

"Can totally recommend! It’s not only full of reports to easily identify low hanging fruit opportunities but also, the most straightforward platform to help run SEO tests"
Aleyda Solis, Intl SEO Consultant, Speaker & Author.
-

"SEOTesting.com has become one of my go-to SEO tools because it does so much with all the valuable data hidden in Google Search Console. It's the only thing that gives us the ability to use that data for keyword tracking, SEO tests, and quality testing."
Ruben Gamez, DocSketch