Custom reports in GA4 allow you to go beyond standard reports by focusing on the data most relevant to your business goals.
Unlike Universal Analytics, GA4 offers flexible and interactive reporting. It allows users to customize metrics, dimensions, and visualizations to gain deeper insights.
Whether tracking organic traffic, user behavior, or conversion paths, custom reports can help streamline analysis and save time by eliminating irrelevant data.
This guide provides best practices, helpful report examples, and key tips for using GA4’s custom reporting features effectively.
What are GA4 custom reports?
GA4’s custom reports are personalized reports you can create or adapt to analyze specific data sets tailored to your business objectives.
These reports help you focus on the most relevant metrics, dimensions, and filters for your goals. They can also give you a detailed understanding of user behavior and its impact on your business.
Custom reports in GA4 are an upgrade from Universal Analytics (UA) custom reports, offering versatile features such as:
- Exploration Reports allowing dynamic data interaction.
- Funnel Reports allowing you to visualize customer journeys effectively.
Unlike the pre-built reports within GA4, custom reports provide more flexibility and focus on the metrics and dimensions that matter most to your business.
How to create custom reports in GA4
To create custom reports in GA4, start with the Explore tab. This tab provides an intuitive workspace for choosing dimensions, metrics, and chart types.
Reports can be created by dragging and dropping elements. The visualizations should be easy to understand and are fully adjustable.
The basic flow of creating a custom report involves the following:
- Defining your data needs.
- Checking existing reports for a good analysis basis.
- Customizing or building a report from scratch.
- Saving the report.
- Optionally, adding it to the navigation menu in GA4.
I’ve highlighted one step in that list because we will focus on it now. In GA4, you can create custom reports by customizing a standard report or building a new one.
We’ll explain both options, step by step, below.
Customizing standard reports
Customizing standard reports within GA4 is ideal when readily accessible reports can be used with only a few changes.
A custom standard report is easier to set up and use compared to dynamic reports in the Explore section.
Remember that editing and customizing reports requires administrator-level access to your GA4 account. If you cannot make changes, check your permission levels or seek help from an administrator.
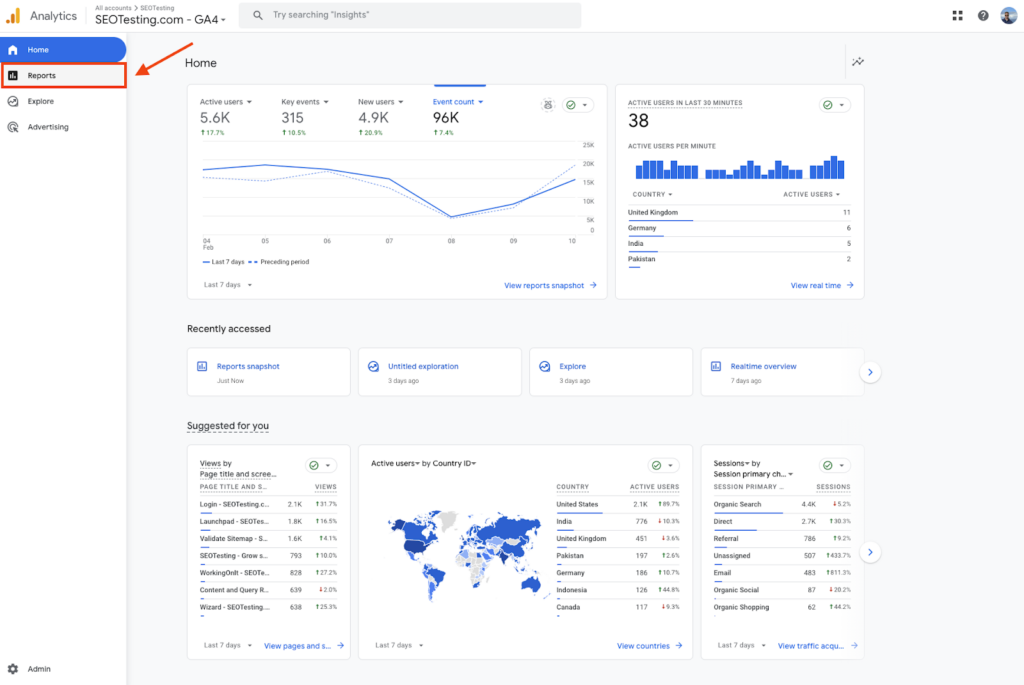
First, click on the ‘Reports’ section on your Dashboard:
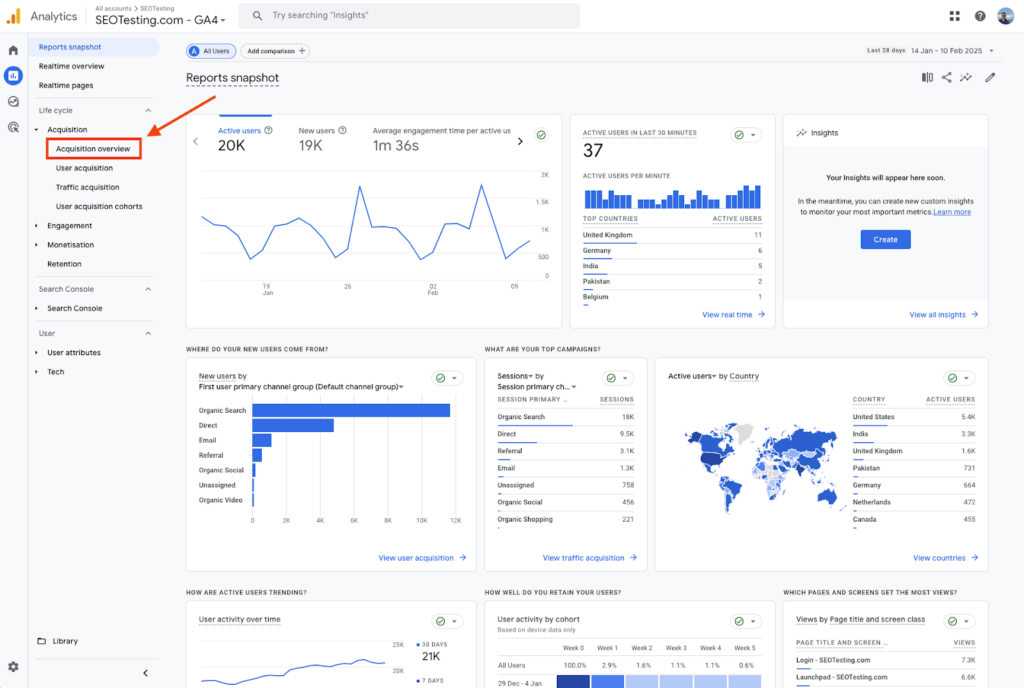
Then click on either a ‘Details’ report or an ‘Overview’ report. For this example, we’ll use the ‘Acquisition Overview’ report:
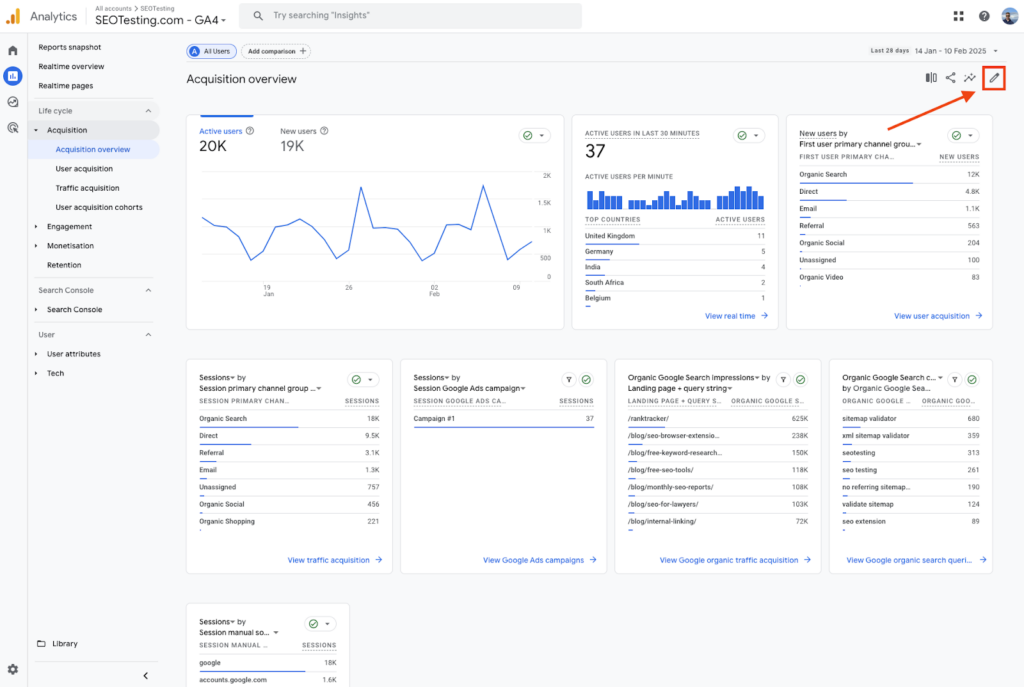
Click on the ‘Customize report’ icon:
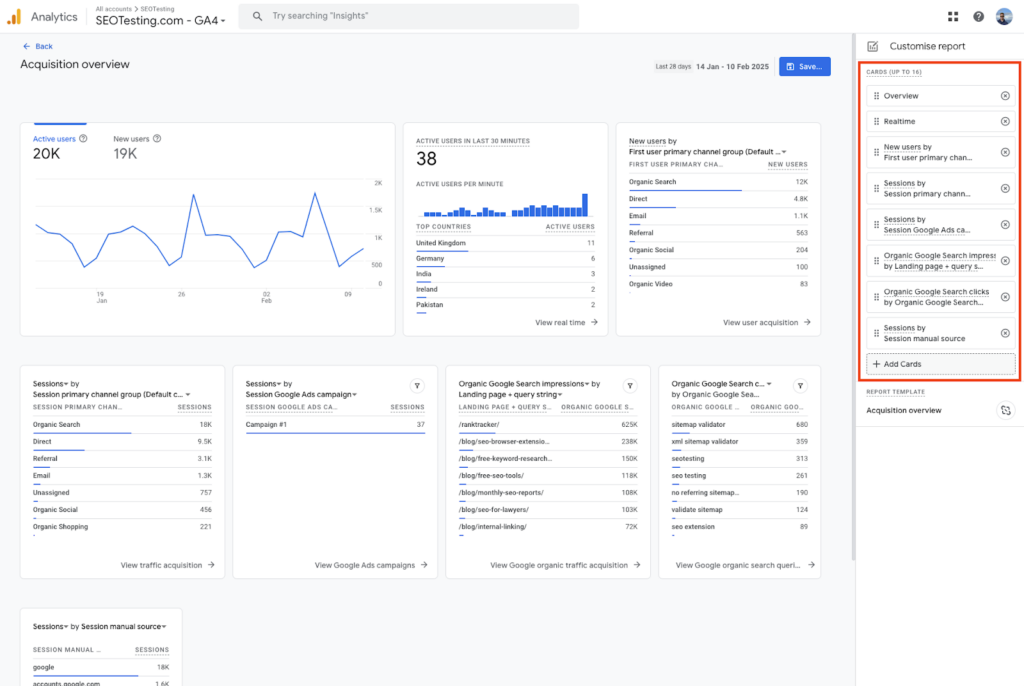
From here, you can start customizing your report elements.
Overview reports can contain a maximum of 16 data cards. You can add or remove cards depending on the report you want to create:
Detail reports have additional editing options available, including:
- Report Data
- Report Filter
- Charts
- Report Template
- Summary Cards
Now, you’ll want to save the report. This can be done by clicking the ‘Save’ button in the upper-right corner:
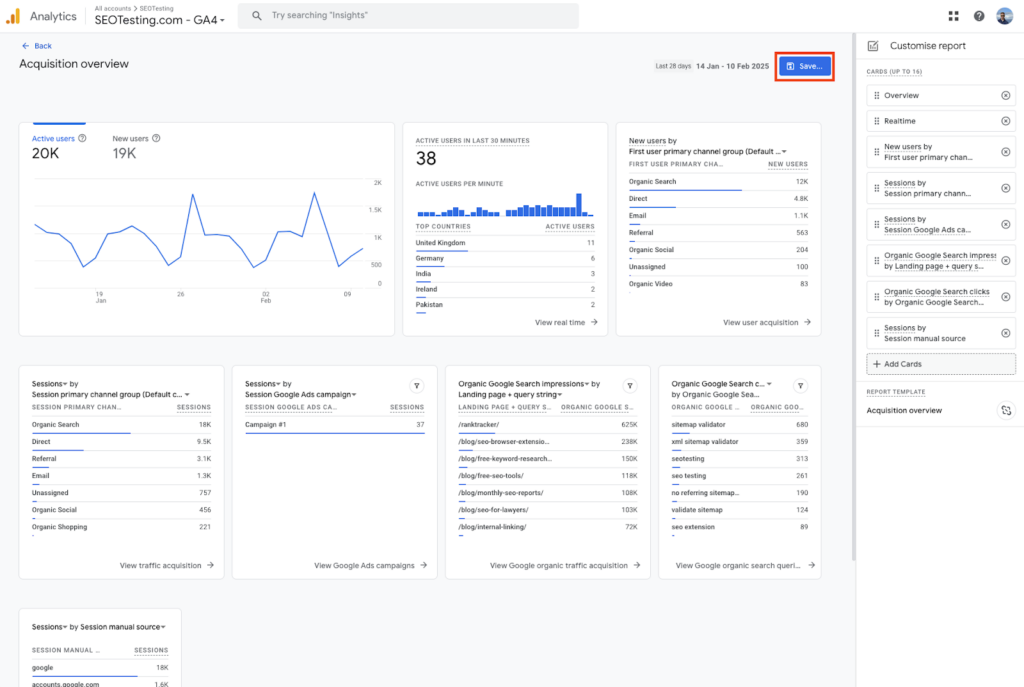
It is better to save as a new report to ensure older reports (and the information they contain) don’t get lost.
Creating custom exploration reports
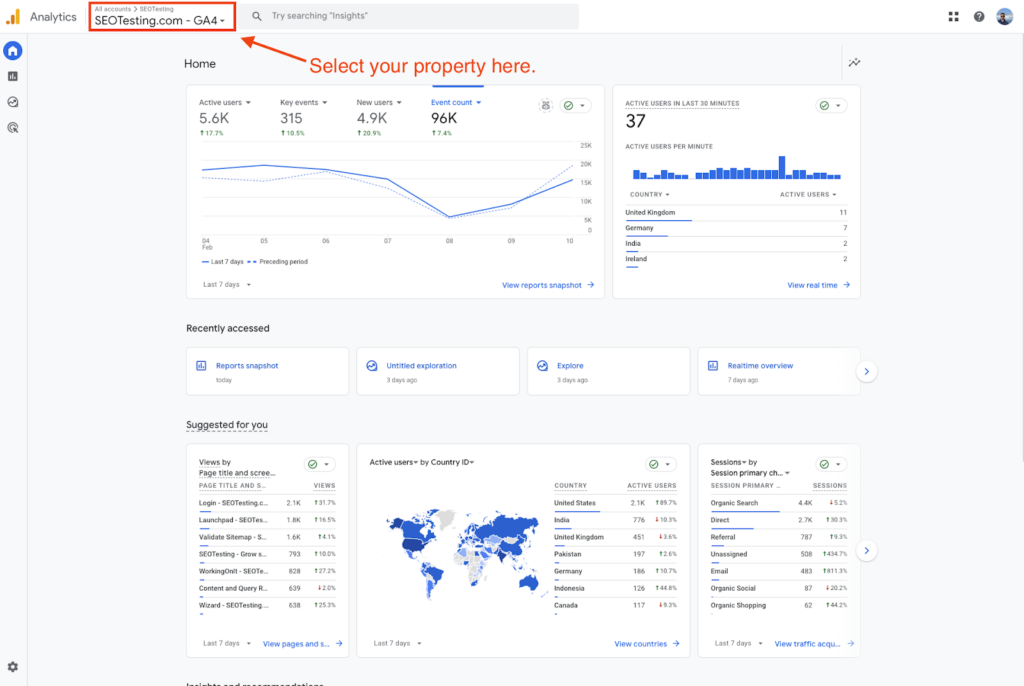
To start creating a custom report within GA4, log in to the GA4 account and select the property that you want to create a report on:
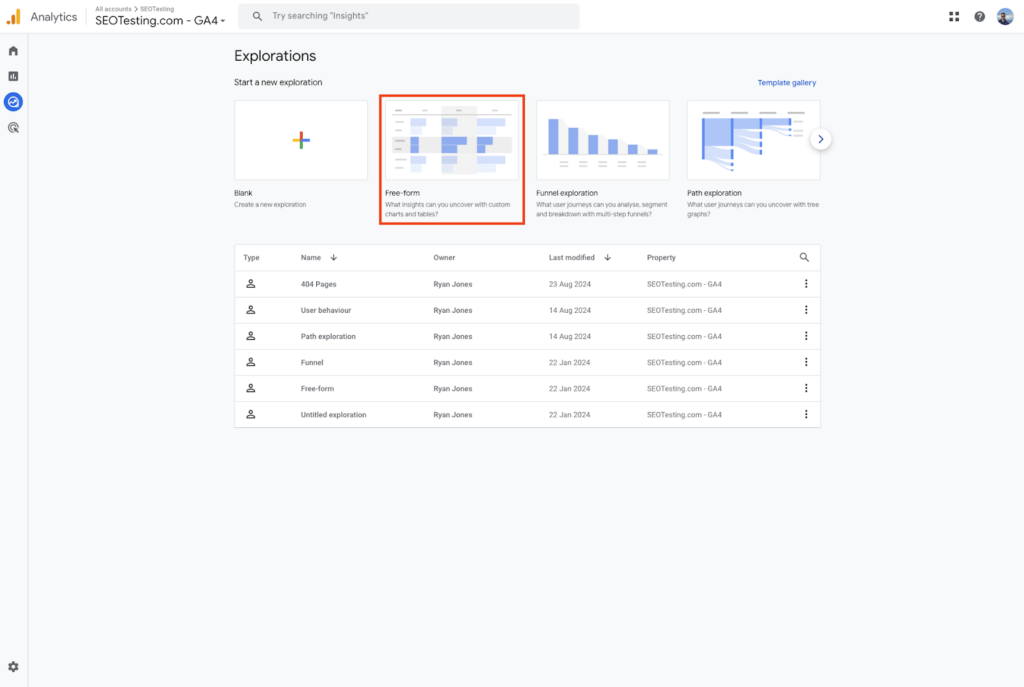
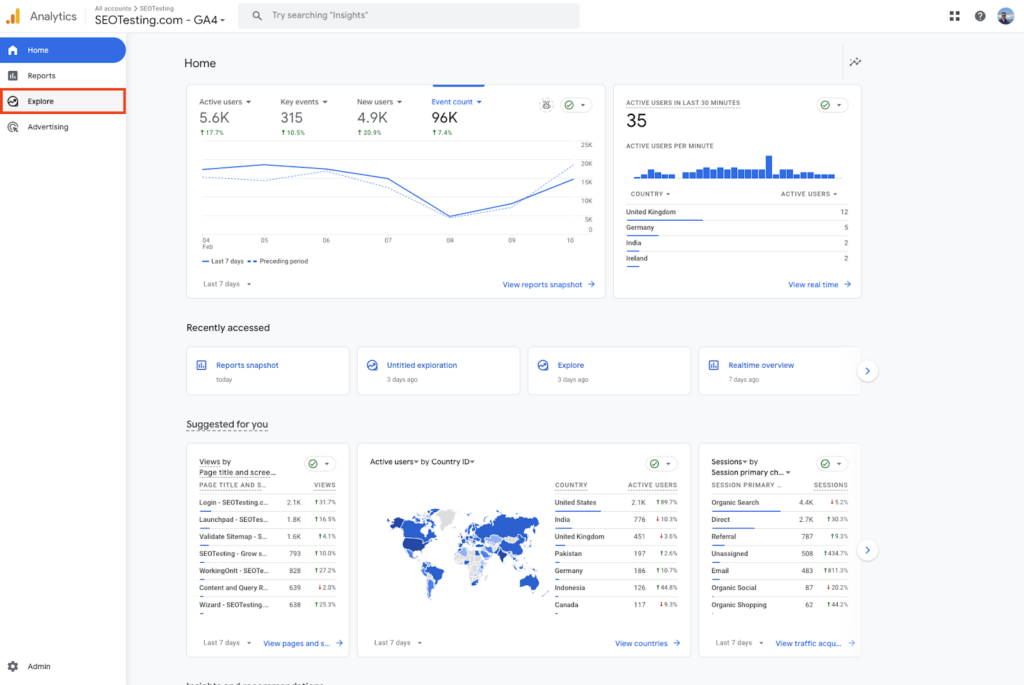
Once you are inside the property, navigate to the Explore tab on the left-hand side menu:

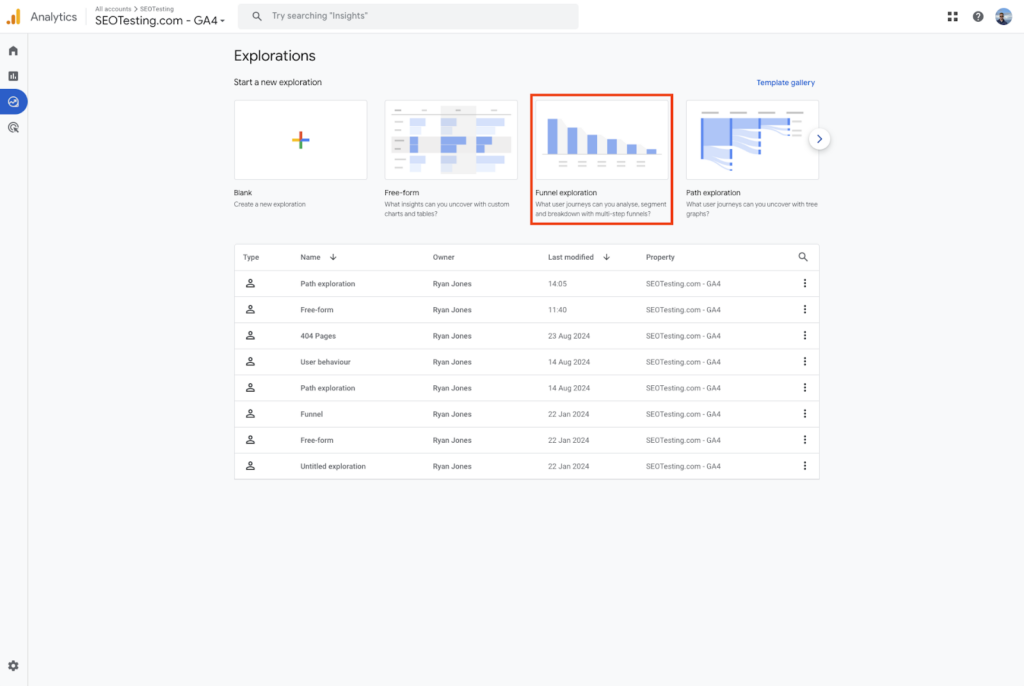
GA4 offers several types of exploration reports:
- Free Form Exploration – A blank canvas where metrics and dimensions can be dragged and dropped to create a custom report.
- Path Exploration – Helps analyze user paths to understand how users navigate a website or app.
- Funnel Exploration – Ideal for visualizing user journeys and identifying drop-off points.
- Segment Overlap – Useful for comparing user segments to see how they interact.
Below is a step-by-step guide on creating custom reports for each exploration type.
Free Form Exploration
Free Form Exploration allows you to dynamically analyze your website’s data by applying rows, columns, and filters interactively.
This type of exploration is ideal for any ad hoc analysis you want.
To create your own Free Form Exploration, start by clicking the ‘Explore’ tab in GA4:

Select the ‘Free Form Exploration’ option:
The next step is to configure your exploration.
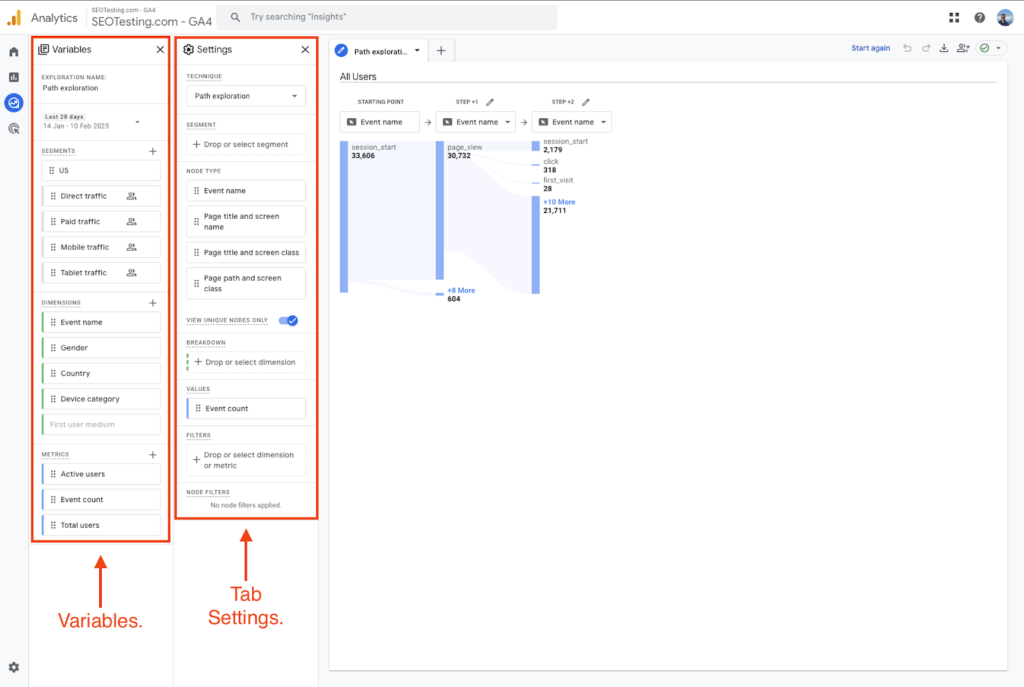
On the left side of your screen, you will see two different columns available.
The left side is your variables panel, made up of things like:
- Segments
- Dimensions
- Metrics
The right side includes your tab settings panel, consisting of things such as:
- Visualization
- Rows & Columns
- Values
- Filters
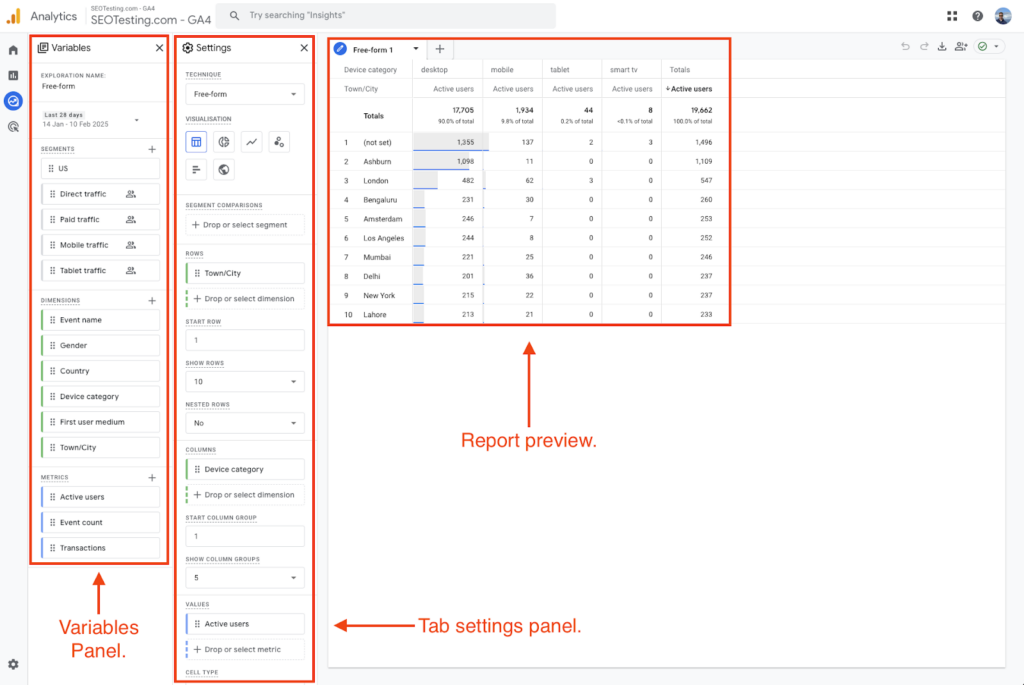
You can click on any cell to explore it further and use the “+” sign to add more dimensions or metrics.
The report will autosave and will be available the next time you open your Explorations panel:
Path Exploration
A Path Exploration will help you see your user journeys and how users interact with your site.
To create your Path Exploration, click on the ‘Explore’ tab within GA4:
Select the ‘Path Exploration’ option:

Much the same as the Free Form Exploration option, you can select your variables from the left side of the table and your tab settings from the right side of the table:
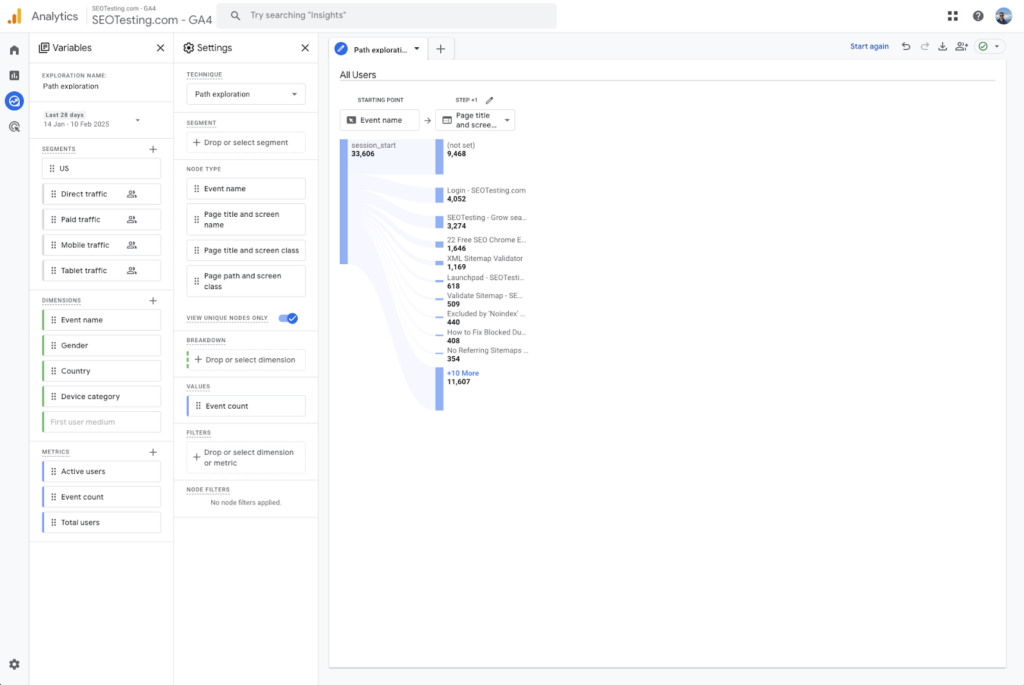
Your Path Exploration preview will feature a starting point of a session start, and from there, you can select different data points to see where your users go. You have different options for this, including:
- Event Name
- Page Title and Screen
- Page Path and Screen
Funnel Exploration
Funnel Explorations help track and improve the conversion paths on your website.
To create a Funnel Exploration, start by selecting the ‘Explore’ tab in GA4:

Select the ‘Funnel Exploration’ option:
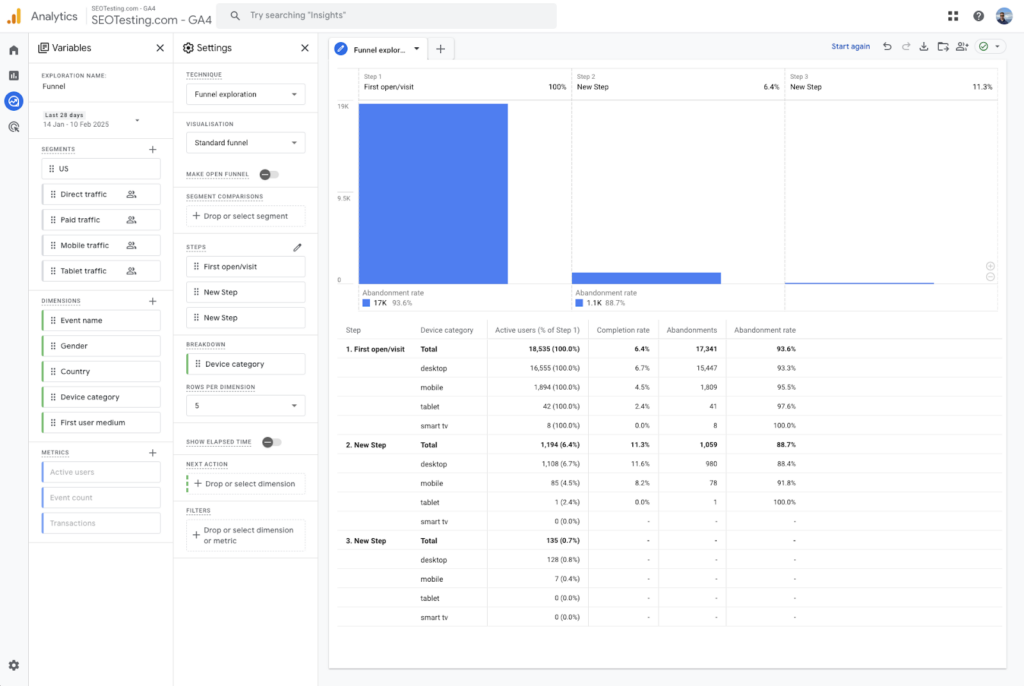
The next step is to define your funnel steps. For example, you can choose different options such as:
- First Open/Visit
- Session Start
- Screen View/Page View
- Purchase
That is what is shown in the screenshot below:
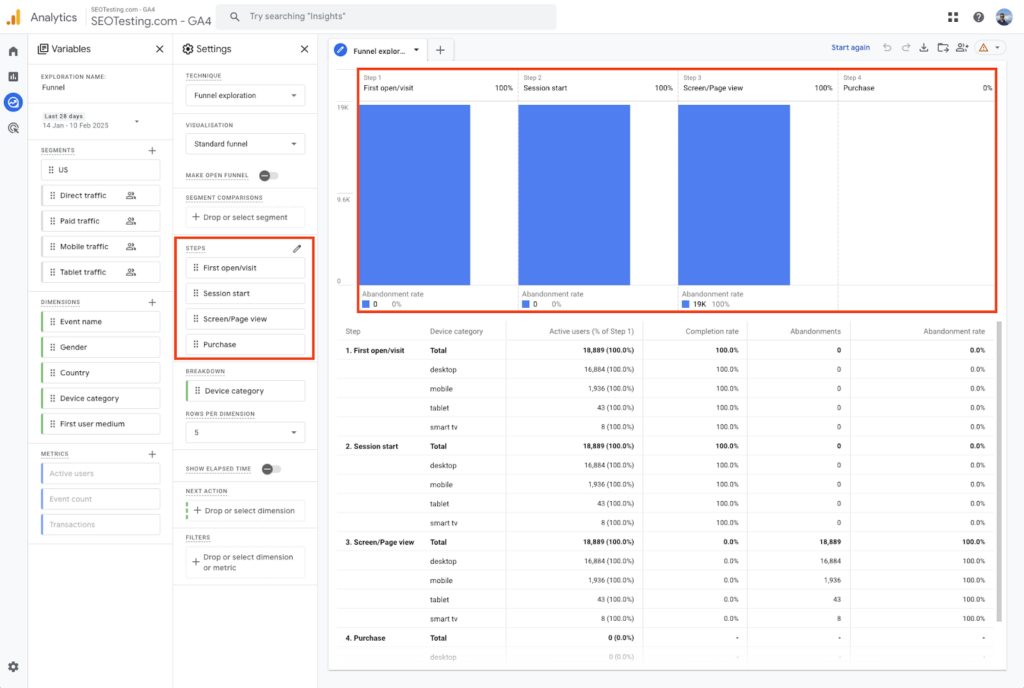
The report you created can then be used to identify drop-off points on your website. You can then use this data to optimize your customer journey:
Top Tip: You can use custom audiences alongside your custom reports in GA4 to go even more granular with your data.
Benefits of using custom reports in GA4
This section will explore the key benefits of using custom reports in GA4 – from tailored insights and enhanced data visualization to improved decision-making, time efficiency, and greater flexibility.
Tailored insights
The primary benefit of using custom reports within GA4 is that you can tailor your insights to your needs.
Instead of sifting through generic data, custom reports provide the information needed to monitor performance against your business’s KPIs.
Enhanced data visualization
Using GA4’s custom reports makes it easy for you to access visualization aspects like:
- Charts
- Tables
- Heatmaps
You can use these aspects to make your site data much more straightforward to interpret and act on.
Custom reports allow you to combine multiple dimensions and metrics into a single report.
Improved decision-making
We all know that accurate data analysis leads you to make better business decisions. The custom reports available within GA4 make it easy for you, as a marketer, to focus on the most relevant and impactful metrics for your website.
Time efficiency
Using custom reports in GA4 improves time efficiency by eliminating the need to manually sift through multiple standard reports to find relevant insights.
Instead of jumping between different pre-built reports and applying filters every time you analyze data, custom reports allow you to preconfigure the exact data views you need, saving you time on repetitive tasks.
For example, an ecommerce manager tracking product performance across different traffic sources would otherwise need to open multiple reports:
- Traffic Acquisition
- Ecommerce Purchases
- User Engagement
And apply filters each time.
With a custom report, they can consolidate all this information into a single, easy-to-read view, instantly providing the insights you need to make informed decisions.
Flexibility
Using custom reports in GA4 leads to greater flexibility. It allows you to tailor your analytics to your unique goals rather than relying on the rigid structure of GA4’s standard, pre-made reports.
Standard reports are limited to Google’s predefined data views and filtering options. While useful, they may not always align with your specific needs or evolving market strategies.
Custom reports allow you to completely control the dimensions, metrics, and filters you apply. Rather than sifting through irrelevant data, you can select exactly what data you want to analyze, how it is displayed, and how it is segmented. This flexibility makes tracking performance based on your KPIs feel easier.
Standard reports vs custom reports
As mentioned, GA4 offers standard and custom reports, which can be used to analyze user behavior, traffic sources, conversions, and more.
While standard reports are pre-configured and cover general website metrics, custom reports allow you to tailor data collection and presentation to your specific needs.
Custom reports provide deeper insights, greater flexibility, and improved control over data visualization. Below, we’ll take you through some key differences between standard and custom reports in GA4.
Structure
Standard reports in GA4 come with a fixed structure. They provide predefined metrics and dimensions such as:
- Traffic acquisition
- Engagement
- Monetization
- Retention
While useful, these may not always align with your business goals.
Custom reports allow you to define the structure of your reports by selecting dimensions (for example, traffic source or device type) and metrics (like session duration or conversion rate) that matter most to you. You can create reports focusing on specific KPIs without unnecessary data cluttering your report.
Customization
Standard reports are incredibly limited when it comes to customization options and only provide basic filtering and segmentation. They help you get some quick insights, but they don’t allow you to edit and customize the output so you can fit them to your specific needs.
On the other hand, custom reports enable you to define the exact data you want to see. You can modify report settings, apply advanced filters, and segment data to extract deeper insights.
Data scope
One of our main complaints about the standard reports within GA4 is that they offer a broad view of your site’s data without the ability to drill down into particular data sets.
Custom reports allow you to control the scope of your data. You can focus on specific traffic segments, event triggers, or conversion paths to better understand performance.
Flexibility
Standard reports are limited in their ability to be modified, so they provide static insights that may not fully align with changing business strategies.
Custom reports allow you to adjust report configurations as your business needs evolve. For example, you can create reports that track different metrics over time or introduce new segmentation criteria.
Visualization options
GA4’s default reports primarily offer simple charts and tables with limited options to visualize your data.
Custom reports, on the other hand, allow you to choose from various visualization formats to better represent data insights, such as:
- Bar charts
- Line graphs
- Scatter plots
- Heatmaps
Use case
The standard reports within GA4 are general-purpose and suit businesses that need basic traffic and conversion insights without needing deeper customization.
Custom reports cater to specific business use cases, such as detailed funnel analysis, user cohort tracking, and segmented revenue tracking.
Setup time
The entire range of standard reports within GA4 is instantly available without any setup, making them ideal for quick insights.
However, while there is an initial time cost associated with setting up custom reports within GA4, once they are set up, they save time by presenting the exact data you need when you need it. This is a game-changer for many businesses that rely on online sources to generate revenue.
Filtering options
When you are looking at standard reports within GA4, you won’t find many options other than the basic filtering options that allow you to segment data by general criteria, such as:
- Country
- Device
- Traffic source
Custom reports offer advanced filtering, allowing you to refine data with even more useful options like:
- User actions
- Specific event parameters
- Custom dimensions and metrics
Best practices for building custom reports
Building effective custom reports in GA4 requires more than selecting metrics and dimensions – you need to structure them to deliver actionable insights. Following best practices ensures that your reports remain relevant, insightful, and aligned with your business objectives.
Focus on KPIs
When creating a custom report, it’s easy to get overwhelmed by the sheer volume of available data.
Instead of tracking every metric, try to focus on key performance indicators (KPIs) that provide meaningful insights into user behavior and business performance.
Whether it’s conversion rates, engagement metrics, or revenue data, each report should highlight the most important figures that drive your decision making.
Choose KPIs that align with business goals
Not all KPIs are relevant to every business, so selecting ones that align with your specific objectives is essential.
For example, an ecommerce store may prioritize cart abandonment rate and average order value metrics. In contrast, a SaaS company might focus on trial-to-paid conversion rates and feature engagement.
Before building a report, define what success looks like for your business and tailor your KPIs accordingly.
Combine multiple reports for a holistic analysis
One of the most potent advantages of custom reports is combining data from multiple standard reports into a comprehensive view.
Instead of switching between different reports for traffic, conversions, and engagement, you can merge relevant data points into one streamlined dashboard.
For instance, a content marketing team could combine traffic acquisition data with engagement metrics to see which sources drive the most valuable readers.
Save, share, and automate custom reports
To maximize efficiency, save your most frequently used custom reports so you don’t have to rebuild them each time.
GA4 also allows you to share reports with team members, ensuring everyone can access the same insights. Additionally, automation tools can help streamline reporting processes by scheduling regular exports or linking GA4 data with external tools like Google Looker Studio for dynamic dashboards.
This is particularly useful for agencies that generate recurring client reports or internal teams that need to monitor KPIs continuously.
Examples of useful custom reports in GA4
Custom reports in GA4 allow you to analyze the most relevant data for your business. While standard reports provide a broad overview, custom reports let you focus on specific insights that align with your goals.
Below are some useful custom reports that can help you optimize performance and make better data-driven decisions.
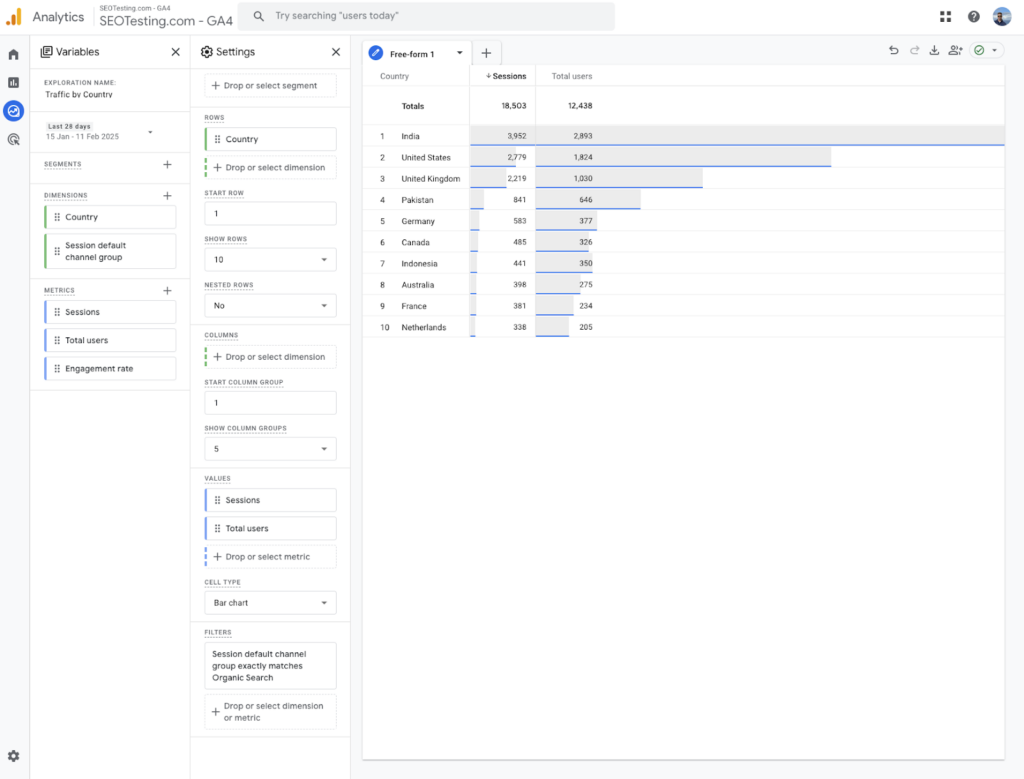
Organic traffic by country
Understanding where your organic traffic comes from can help you tailor your content and marketing strategies for different regions.
A custom report tracking organic sessions by country shows which locations drive the most traffic and engagement.
This is particularly useful for businesses operating in multiple markets or expanding into new regions.
To create this report:
- Log into GA4 and go to the “Explore” section.
- Click “Blank” to create a new exploration.
- Give your report a name (e.g., Organic Traffic by Country).
- In the Variables panel, click + next to Dimensions, then search and select:
- Country
- Session default channel group
- Click + next to Metrics, then search and select:
- Sessions
- Users
- Engagement Rate (optional)
- Drag Country to the Rows section.
- Drag Sessions and Users to the Values section.
- Drag Session Default Channel Group to the Filters section and set it to “Organic Search”.
- Click Apply to filter the report.
- You will now see organic traffic by country. You can sort by Sessions to see the top countries.
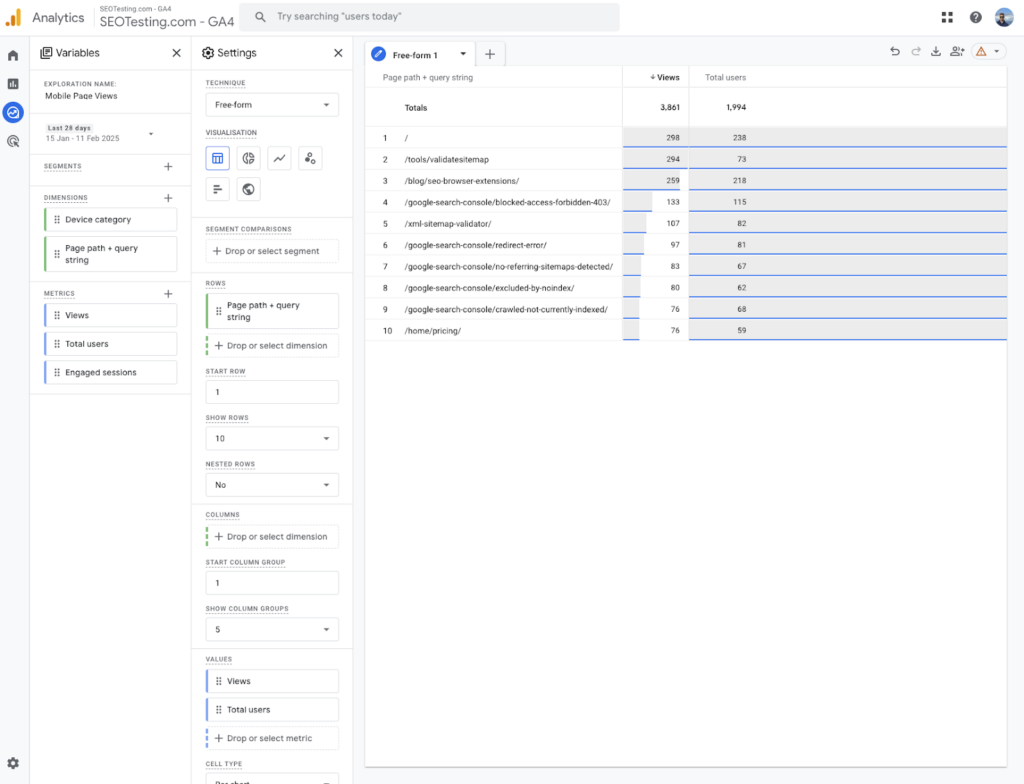
Pages on mobile devices
With mobile traffic continuing to dominate, knowing how your website performs on different devices is essential.
A custom report on mobile device page performance can highlight slow-loading pages, high bounce rates, and mobile user engagement.
For example, an e-commerce store might discover that certain product pages have lower mobile conversion rates than desktop ones. This insight can encourage the store to prioritize mobile optimizations, such as improving page speed, refining UX design, or simplifying checkout processes.
To create this report:
- Log into GA4 and go to “Explore”.
- Click “Blank” to create a new exploration.
- Name your report (e.g., Mobile Page Views).
- In the Variables panel, click + next to Dimensions, then search and select:
- Page Path + Query String (or “Page Title” if preferred)
- Device Category
- Click + next to Metrics, then add:
- Views
- Users
- Engaged Sessions (optional)
- Drag “Page Path + Query String” to the Rows section.
- Drag “Views” and “Users” to the Values section.
- Drag “Device Category” to the Filters section and set it to “Mobile”.
- Click Apply to filter the report.
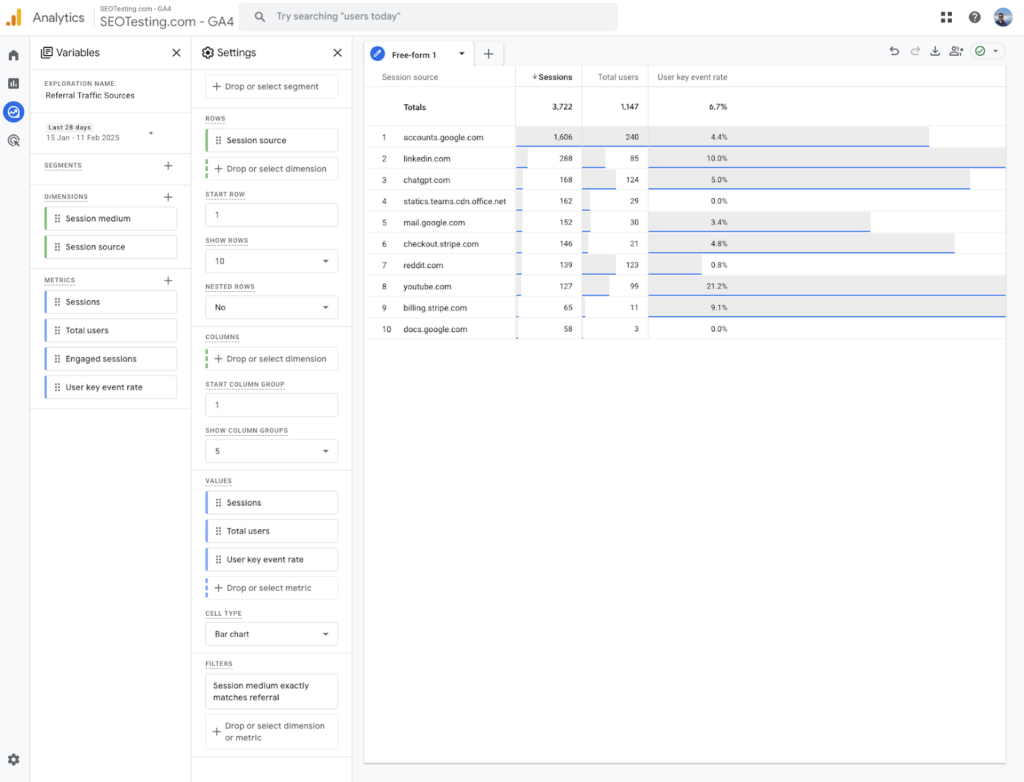
Referral traffic
Referral traffic reports show which external sources are driving users to your website.
A custom referral traffic report can help you track which partnerships, guest blog posts, or third-party mentions bring the most engaged users.
You can focus on high-value sources contributing to conversions by filtering out low-quality or spam referrals.
For example, if a SaaS company sees that a specific industry blog drives trial sign-ups, it might consider increasing guest contributions or running joint promotions with that website.
To create this report:
- Log into GA4 and go to “Explore”.
- Click “Blank” to create a new exploration.
- Name your report (e.g., Referral Traffic Sources).
- In the Variables panel, click + next to Dimensions, then search and select:
- Session source (shows the website that referred users)
- Session medium (optional: confirms it’s a referral)
- Click + next to Metrics, then add:
- Sessions
- Users
- Engaged Sessions (optional)
- Conversions (if tracking goal completions)
- Drag “Session Source” to the Rows section.
- Drag “Sessions” and “Users” to the Values section.
- Drag “Session Medium” to the Filters section and set it to “referral”.
- Click Apply to filter the report.
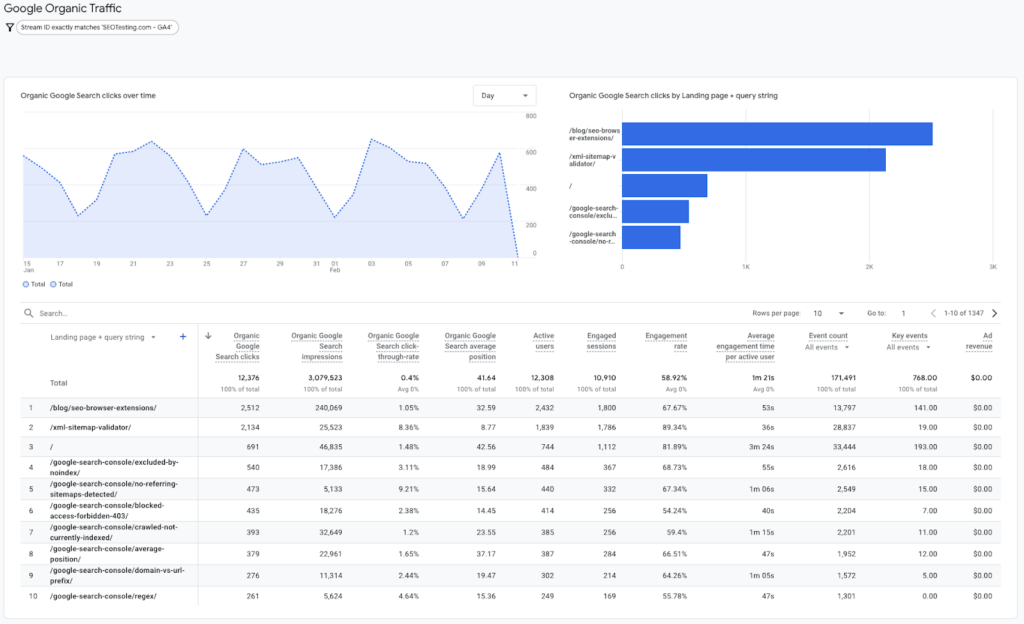
Google Search Console reports
While GA4 provides insights into search traffic, integrating Google Search Console allows for a deeper analysis of organic search performance. Creating a custom report with GSC data allows you to track keyword rankings, CTR, impressions, and organic clicks.
This is particularly valuable for SEO teams who monitor which queries drive traffic and which pages need optimization.
For example, if a blog post ranks well but has a low CTR, optimizing its title and meta description could increase organic traffic without requiring new content.
To create this report:
- Go to GA4 and click Reports.
- Click Library (bottom left).
- Click Create new report > Create detail report.
- Choose “Table” as the visualization.
- Add Dimensions:
- Landing Page + Query String (to see which pages get search traffic)
- Country (optional, to break down by location)
- Device Category (optional, to compare mobile vs. desktop)
- Add Metrics:
- Google Organic Clicks
- Google Organic Impressions
- Google Organic CTR (Click-Through Rate)
- Google Organic Average Position
- Apply Filters (Optional):
- Set “Session Default Channel Group” to “Organic Search” to isolate Google Search traffic.
- Click Save and Publish.
Remember, for this to work, you must connect your Google Search Console account to your GA4 account.
Frequently asked questions
To conclude this article, we’ll answer some common questions that users have about custom reports in GA4.
What are GA4 summary cards?
GA4 summary cards give you a quick overview of the most critical data in your reports.
They condense key metrics, trends, and insights, making it easy to obtain vital information quickly.
How do I download custom reports?
Downloading custom reports in GA4 is simple. Go to the ‘Export’ options in the upper-right corner of a custom report. You can choose to download the report in various formats, such as:
- CSV
- XLSX
How do I use GA4 explorations?
GA4 explorations help you dive deep into your analytics data to uncover new insights.
To start using explorations, head to the ‘Explore’ tab in GA4 and select the type of exploration you want to create. GA4 can help you analyze various aspects of your data flexibly and interactively.
Can you share custom reports?
Yes, you can share custom reports in GA4, but the sharing functionality is limited compared to previous versions of Google Analytics.
While it’s not possible to send a link directly to a custom report, you can export the data in different formats (such as CSV, PDF, or Google Sheets) and share it manually.
Additionally, if you’re using Looker Studio (formerly Google Data Studio), you can connect your GA4 data and share interactive reports with team members.
Can you create a custom report snapshot?
GA4 does not have a built-in “snapshot” feature for custom reports, but you can manually create one by taking a screenshot of the report or exporting it as a PDF.
If you’re using the Explorations tool, you can save your custom report within GA4 so you can return to it later without needing to rebuild it. Additionally, you can integrate GA4 with Looker Studio and set up automatic updates if you want an ongoing report snapshot.
How can I delete a custom report in GA4?
To delete a custom report in GA4:
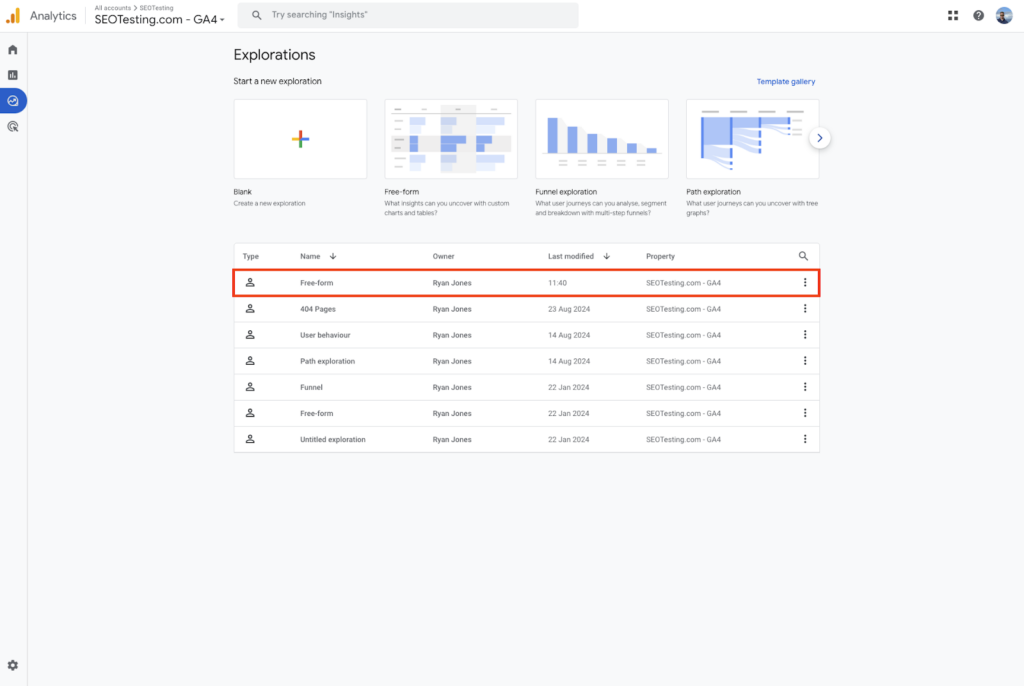
- Go to Explore in GA4.
- Find the custom report (Exploration) you want to delete.
- Click on the three-dot menu (⁝) next to the report.
- Select Delete and confirm the action.
Once deleted, the custom report cannot be recovered, so be sure to export any necessary data before removing it.
Wrapping things up
GA4’s custom reports provide greater flexibility, efficiency, and deeper insights. They allow businesses to focus on KPIs, streamline analysis, and improve decision-making.
Custom reports help refine marketing and SEO strategies by tracking organic traffic trends, measuring mobile performance, and assessing referral impact.
By saving, sharing, and automating reports, teams can instantly reduce manual work and access key insights. Investing in custom reporting ensures you make data-driven decisions that optimize performance and drive business growth.
Custom reports in GA4 help you uncover opportunities to test on your site. SEOTesting enables you to track the results. You can see what’s working and optimize faster with automated reporting, keyword tracking, and SEO experiments.
🚀 Start your free 14-day trial today—no credit card required! 👉 Try SEOTesting for Free
Testimonials
-

"Can totally recommend! It’s not only full of reports to easily identify low hanging fruit opportunities but also, the most straightforward platform to help run SEO tests"
Aleyda Solis, Intl SEO Consultant, Speaker & Author.
-

"SEOTesting.com has become one of my go-to SEO tools because it does so much with all the valuable data hidden in Google Search Console. It's the only thing that gives us the ability to use that data for keyword tracking, SEO tests, and quality testing."
Ruben Gamez, DocSketch