Imagine this scenario. An SEO test has finished running on your website. Traffic has spiked 15%.
But did your changes cause this boost? Or was it just luck?
This is a question that every SEO professional needs to be able to answer. You need to know if your test results are real or random. Statistical significance gives you that information.
Statistical significance tells you whether your SEO changes actually worked. It separates real wins from correlational changes. Without it, you’re gambling with your website’s performance.
Key Takeaways
- Statistical significance tells you if your SEO changes actually caused performance improvements or if results happened by chance.
- Use a 95% confidence level (p-value < 0.05) as the industry standard for determining significant results.
- Run SEO tests for at least 4-6 weeks to account for natural traffic fluctuations and get reliable data.
- Always set a clear hypothesis before testing. Don’t just experiment randomly with website changes.
- Monitor external factors like Google algorithm updates and seasonality that can skew your test results.
- Tools like SEOTesting automatically calculate statistical significance, so you don’t need to do complex math.
- Never end tests early when you see good results. This creates bias and leads to false conclusions.
Table of Contents
- What is Statistical Significance?
- Why Statistical Significance Matters in SEO Testing
- How SEO Testing Works
- SEO Testing Tools
- How to Run a Statistically Significant SEO Test
- Understanding Hypothesis Testing
- Measuring Reliability and Accuracy
- Real-World Case Study
- When to Ignore Statistical Significance
- Mistakes to Avoid
What is Statistical Significance?
Statistical significance answers one simple question: Did your change cause the result?
Think of it like flipping a coin. If you flip a coin ten times and get heads seven times, that could happen by chance. But if you flip it 1,000 times and get 800 heads, something has happened to the coin to cause that.
SEO testing works the same way. Small changes in traffic might be random. Big changes over long periods are more likely real.
Statistical significance uses math to measure this likelihood. It tells you the probability that your results happened by chance.
During SEO tests, most SEO professionals will aim for a 95% confidence level. Essentially meaning that there is only a 5% chance that the results seen during an SEO test was random.
Why Statistical Significance Matters in SEO Testing
SEO testing without statistical significance is guesswork.
Here’s why it matters:
You avoid false conclusions: Traffic naturally fluctuates. Your “winning” test might just be a lucky week. Statistical significance filters out these false positives.
You save money and time: Bad decisions based on random results waste resources. You might implement changes that don’t actually work.
You build reliable SEO strategies: Validated test results create a foundation for future optimizations. Each confirmed win builds on the last.
You reduce risk: Large websites can’t afford to guess. Statistical significance gives you confidence before rolling out changes site-wide.
Without statistical significance, you’re flying blind. Your SEO strategy becomes a series of random experiments instead of data-driven decisions.
How SEO Testing Works
SEO testing uses two main approaches to measure the impact of your changes:
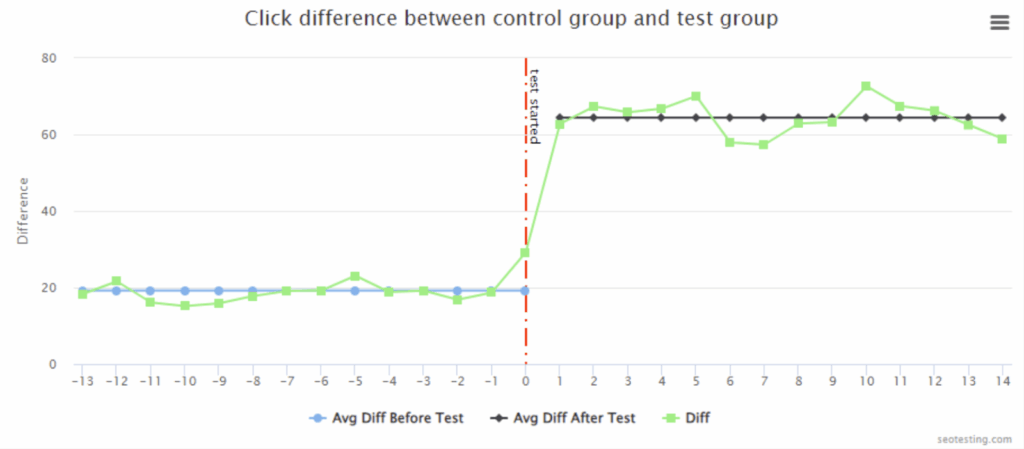
Split Testing
Split testing compares one group of pages against another group. You divide similar pages into two groups:
Test Group: The group of pages on which you make your change. Such as adding FAQ sections.
Control Group: This group of pages stays unchanged.
Both groups run simultaneously. You measure performance differences between them.
This method works well when you have lots of similar pages, like product pages or blog posts.
Note: When we refer to split testing, we are referring to the process of running SEO A/B tests.
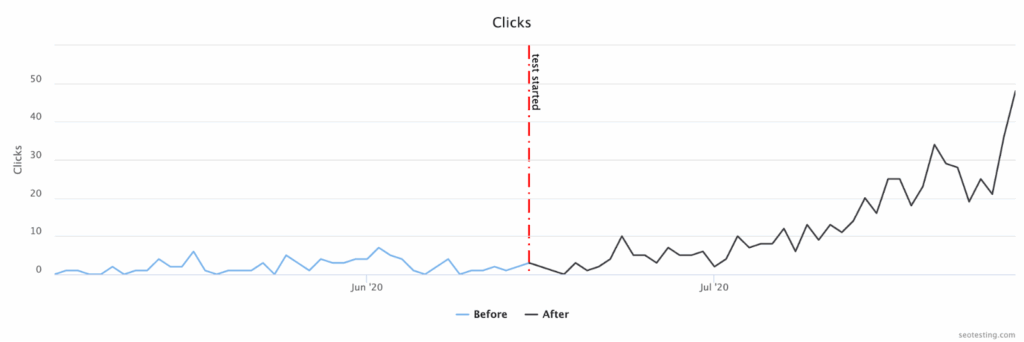
Time-Based Testing
Time-based testing compares performance before and after you make changes. You measure the same pages across two time periods.
Before Period: This is your baseline performance without changes.
After Period: This is your performance with your changes implemented.
You compare metrics between these periods to see if your changes worked.
This method works well for site-wide changes or when you don’t have enough pages for split testing. Or any change where you only need to experiment on one page, or a small group of pages.
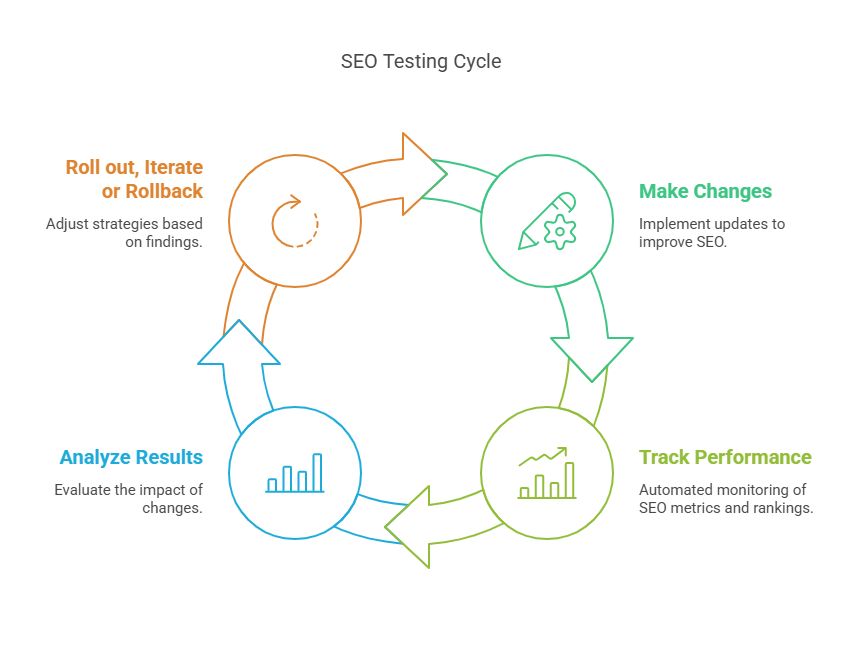
The Testing Process
Both methods follow the same basic steps:
You create a hypothesis: For example, adding an FAQ section will increase organic traffic.
You measure performance: Track metrics like organic traffic, average position, or click-through rate.
You analyze results: Statistical significance tells you if your changes are real or random.
You make decisions: Roll out winning changes, roll back failed changes, or try new tests.
The key is controlling variables. Only one thing should change between your test periods or groups. This way, you know what caused any performance differences.
For more details on both testing methods, check out our SEO testing guide.
Nick Swan, SEOTesting’s Founder, came up with this cycle for SEO testing and shared it to his LinkedIn followers:
SEO Testing Tools
Most specialist SEO testing tools will calculate statistical significance for you. Here are the three most popular SEO testing tools on the market today:
SEOTesting
SEOTesting is a tool for running SEO time-based tests and split tests. SEOTesting integrates with Google Search Console to track organic traffic, impressions, and click-through rates.
It’s designed specifically for SEO professionals who want to run reliable tests without technical complexity.
SEOTesting handles all statistical calculations for you.
It automatically calculates p-values for all of your test types. It accounts for traffic fluctuations and provides clear confidence intervals.
Alongside the main test result screen, giving you your test scorecard and data graphs:
You get a simple win/loss test result page without needing to understand the math.

seoClarity
seoClarity is an enterprise SEO platform that includes split testing functionality alongside rank tracking, keyword research, and content optimization tools.
The platform integrates testing with your broader SEO data to provide comprehensive performance insights.
seoClarity uses statistical analysis to determine test significance, though the specific methodology isn’t always transparent to users.
The platform calculates confidence levels and provides automated reporting on test results. It focuses more on practical outcomes than detailed statistical breakdowns.
SearchPilot
SearchPilot specializes in large-scale SEO testing for enterprise websites with thousands of pages.
The platform uses an approach called “smart bucketing” to create statistically similar control and variant groups.
It’s designed for companies that need highly sensitive analysis to detect even small performance changes across complex website structures.
SearchPilot uses a proprietary neural network-based statistical model rather than traditional hypothesis testing.
Instead of comparing control vs variant groups directly, it builds a counterfactual forecast of what the variant pages would have performed like without changes.
The platform uses a Bayesian approach to show what really caused a change. It spots and removes outliers on its own. It also adjusts for things like seasonality or Google updates. This helps you see the real impact of your SEO changes.
How to Run a Statistically Significant SEO Test
Follow these eight steps to run reliable SEO tests:
Define Your Hypothesis
Start with a clear hypothesis. Don’t just test random changes.
Good hypothesis: Adding customer reviews to product pages will increase organic traffic by 10%.
Bad hypothesis: Let’s see what happens when we change the title tags.
Your hypothesis should be specific and measurable. It guides your entire test.
Choose Your Metrics
Pick one primary metric to measure success. Some common KPIs that are used during SEO testing are:
- Organic traffic
- Click-through rates
- Conversion rates
- Average position
Don’t track too many metrics. Having to compare too many things can increase the chances of false positives in your tests.
Note: While it is advisable to pick one primary success metric, that doesn’t mean you cannot track additional metrics! Having access to these metrics is useful in all SEO tests. But be aware that tracking too many things can cause confusion.
Choose Your Pages
Now that you have defined your hypothesis and chosen your metrics, you need to choose the pages you want to test on.
Pages should (generally) be getting clicks on a day-to-day basis, and be at a steady level. You want to avoid testing on pages with wildly spiky graphs if you can, as this could lead to results that aren’t statistically significant. That being said, weekend fluctuations would be expected, as shown in the data over a long period of time.
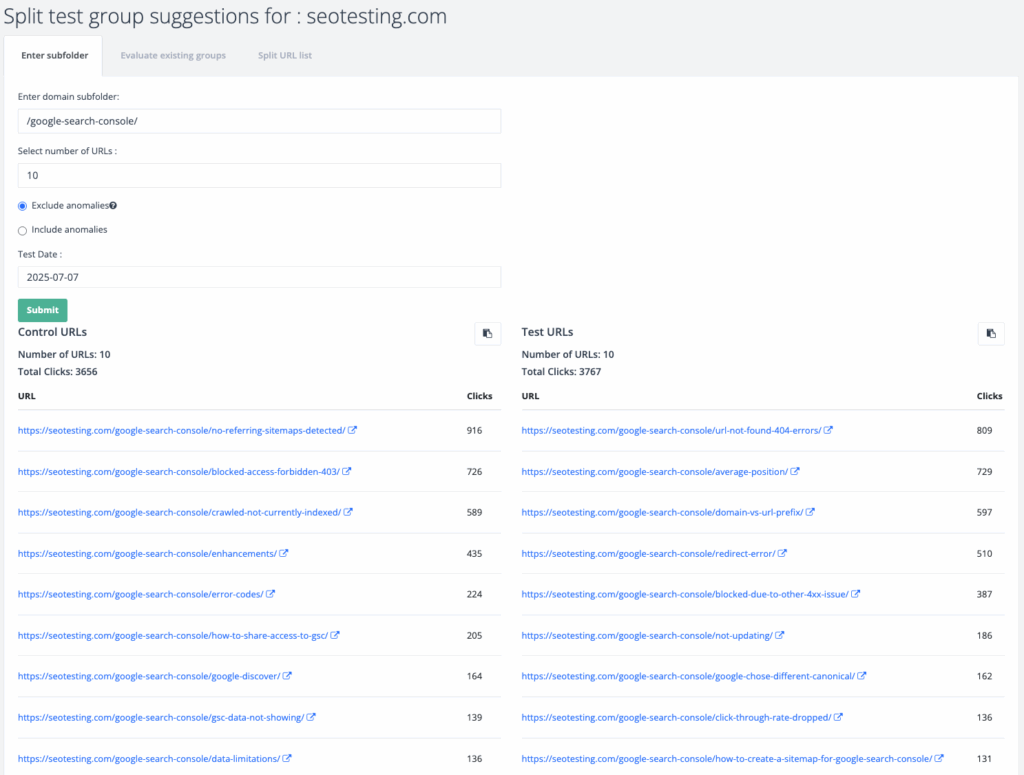
The rules for setting test pages are the same whether you’re running a time-based SEO test or a split test. However, if you do need to run a split test, SEOTesting has a split test group configuration tool to help you find suitable test and control pages:
Set a Time Period
Determine how long your test will run before you start. Most SEO tests need at least 4-6 weeks.
Consider these factors:
- Traffic volume (more traffic = shorter tests)
- Seasonality patterns
- Expected effect size (some tests will have much bigger results than others)
Never end a test early just because you see good results! This creates bias in your data.
Gather Data
Let your test run for the predetermined time. Collect data consistently across both test and control groups (if you are performing a split test). If you are running a time-based test, leave the page/s untouched while the test runs.
Monitor for external factors like:
- Confirmed algorithm updates
- Seasonal changes
- Marketing campaigns
- Technical issues
Document anything that might impact your results, positive or negative.
Calculate Statistical Significance
Most SEO testing tools do this automatically. If you are calculating statistical significance manually, you’ll need:
- Sample sizes for both groups (if performing a split test)
- Mean performance for each group
- Standard deviation of results
The calculation produces a p-value. Values below 0.05 indicate statistical significance at a 95% confidence level.
For split tests, use a two-sample t-test.
- First find the difference between the two group averages.
- Then figure out the standard error for that difference.
- Next divide the difference by the error to get your t-score.
- Last check that score against a chart to find your p-value.
For time-based tests, use a one-sample t-test:
- Calculate the percentage change from before to after.
- Calculate the standard error of this change.
- Divide the change by the standard error to get your t-statistic.
- Compare to critical values for your p-value.
Pro Tip: Use online calculators or tools like Excel’s T.TEST function to avoid manual calculations. SEOTesting, on the other hand, handles all of this automatically.
Interpret Results
Do not stop at statistical significance. Think about:
- Effect size: Is the difference large or small?
- Practical impact: Does the change matter in real life?
- Confidence interval: What range could the true result fall in?
A statistically significant 1% improvement might not be worth the effort to implement.
Make Your Decision
Use your SEO test results to decide on your next steps:
- Saw a big improvement? Roll-out that change to the rest of your site.
- Did the SEO test fail? Roll the change back, or skip the planned rollout.
- No change? Find something new to test instead.
This is why keeping a log of all your SEO tests is important. You can see what you’ve tested previously, the results these tests had, and you can use it to give yourself ideas on what to test instead.
Understanding Hypothesis Testing
Hypothesis testing forms the entire framework for statistical significance. Here are the key concepts you need to know about:
Null and Alternative Hypotheses
Each test begins with two ideas:
Null hypothesis: Your change did nothing. The results happened by chance.
Alternative hypothesis: Your change caused the results.
The goal is to prove the null wrong. If you can’t then the change likely had no effect.
P-Value Explained
The p-value shows how likely your results are just random.
If it’s 0.05 that means there’s a 5% chance your results happened by chance.
The lower the number the more likely your change made a real difference.
Here are common p-value cutoffs used in SEO testing:
- P-value < 0.05: Statistically significant.
- P-value < 0.01: Highly significant.
- P-value < 0.001: Very highly significant.
As mentioned above, most SEO tools work to a p-value of 0.05.
Confidence Levels
Confidence levels are the flip side of p-values.
A p-value of 0.05 means you are 95% confident in that result.
This means you’re mostly sure your change caused the result. But there’s still a small chance you’re wrong.
If you want to be more certain you’ll need stronger proof. More confidence takes more data.
Measuring Reliability and Accuracy
Statistical significance is by no means perfect. There are still a number of factors that can impact the reliability of your SEO test results:
Confidence Intervals
Confidence intervals give you a range where the real result likely falls.
A tight range means you can trust the number more. A wide range means there’s more guesswork.
For example: “Traffic went up 10% with a range of 5% to 15%.” The real increase is probably somewhere in that range.
Seasonality and Natural Fluctuations
Search behavior changes throughout the year. Holiday shopping, back-to-school periods, and industry events all impact traffic.
Account for seasonality by:
- Running tests during stable periods.
- Comparing to the same time last year.
- Using longer test durations.
- Monitoring industry trends.
Ignore seasonal effects at your own risk. They can make random changes look statistically significant.
Does this mean you cannot run SEO tests during periods of seasonal changes? No.
If you do need to run SEO tests in periods being impacted by seasonality, your best option is to run split tests. Due to comparing a control group and a test group being used, seasonal changes are taken into account.
Google Algorithm Updates
Google updates can throw off your test. A big change in the middle can shift results either way.
Before you wrap up a test check for any confirmed updates.
Google’s Search Liaison account on X shares the big ones.

If an update occurs during your test, consider:
- Extending the test duration.
- Restarting after traffic stabilizes.
- Adding the update as a factor in your analysis.
Real-World Case Study
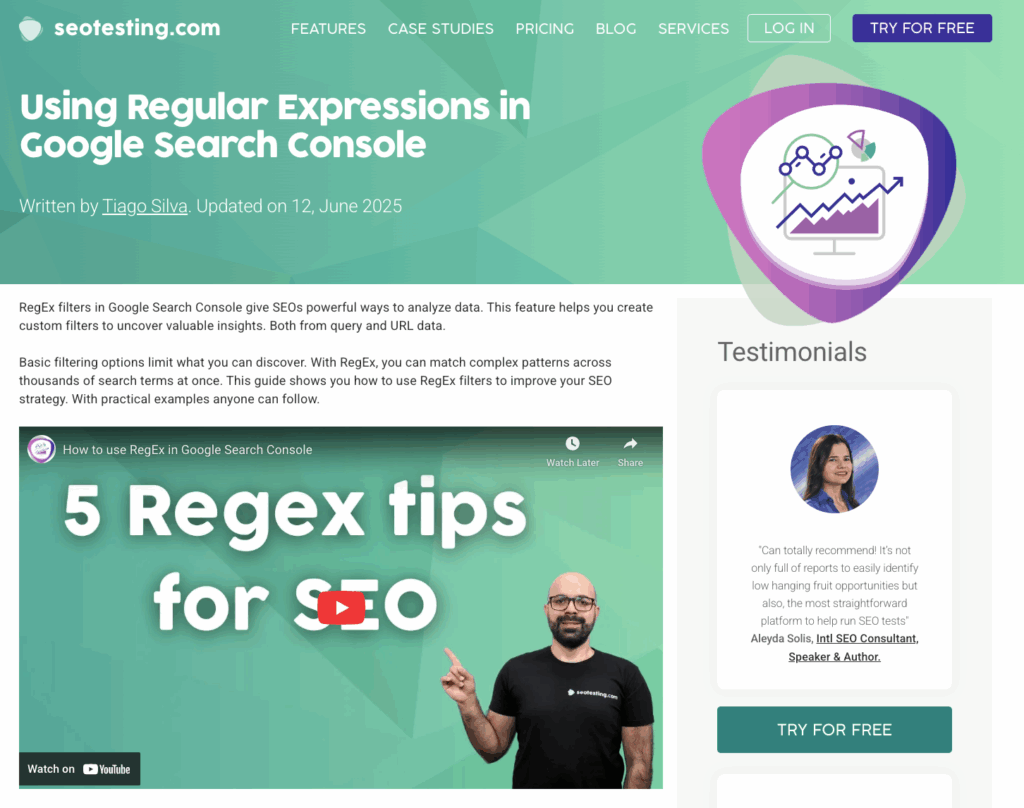
Here’s how statistical significance worked in a real SEO test we ran on our Google Search Console RegEx guide.
The Hypothesis
We aimed to find out if three changes would get us more clicks:
- Making the content easier to read
- Focusing on better search terms
- Cutting out anything unnecessary
Our thinking was simple:
“If we trim the article improve clarity and tweak meta tags we should see a lift in organic traffic.”
The Website Changes
We executed on a full content refresh on our RegEx guide:
Content Improvements:
- Removed unnecessary content (2,484 words → 1,232 words)
- Improved readability (Grade 9 → Grade 6 from Hemingway)
- Cut reading time in half (9:56 → 4:55)
- Used headings that targeted search queries.
Meta Tag Optimization:
- Old title: “Google Search Console RegEx: An SEOs Guide to Using Regular Expressions”
- New title: “RegEx for Google Search Console: A Practical SEO Guide”
- Old description: “Do advanced filtering on page and query data in Google Search Console using regular expressions (RegEx). We take you through how to use them in GSC, and have some great examples to get you started.”
- New description: “Master RegEx filters in Google Search Console to find keyword opportunities, analyze pages, and track user intent with hands-on examples”
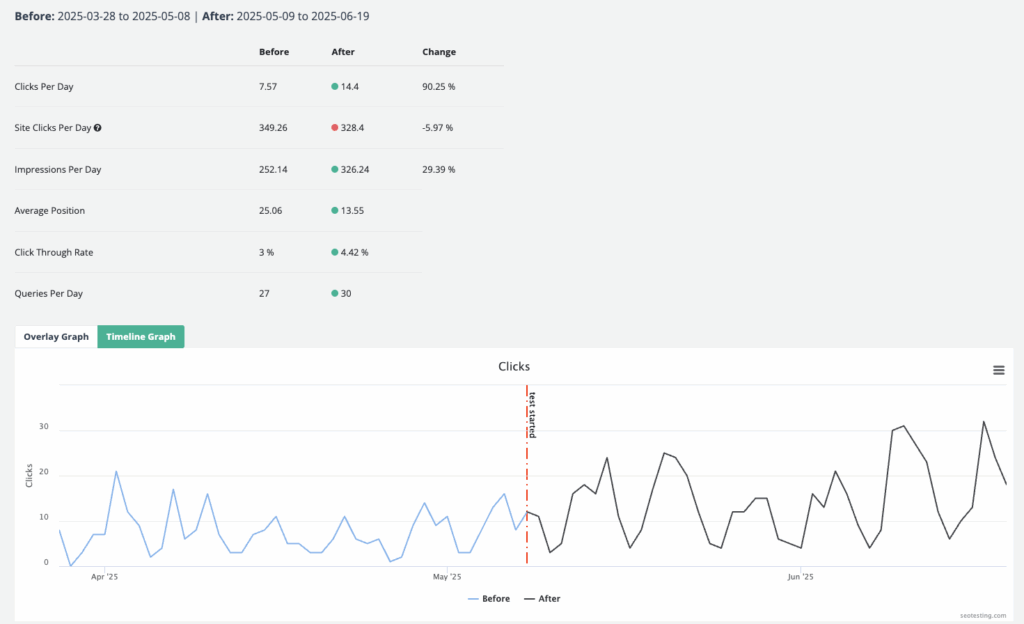
The Results
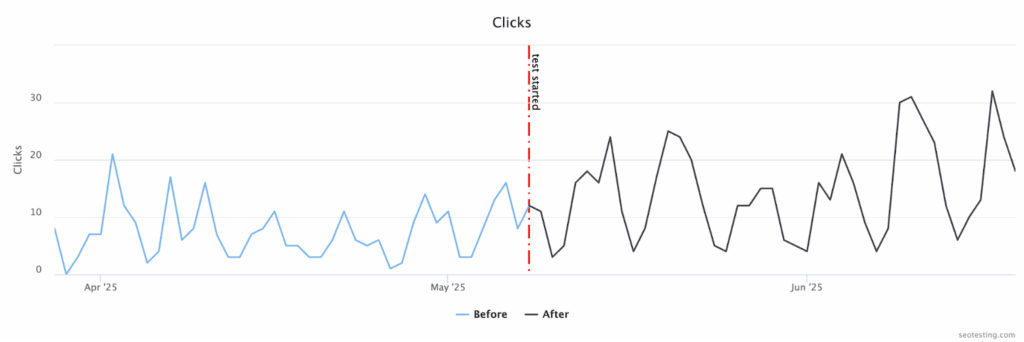
We checked the article’s numbers for 42 days before and after the update.
After the change this is what happened:
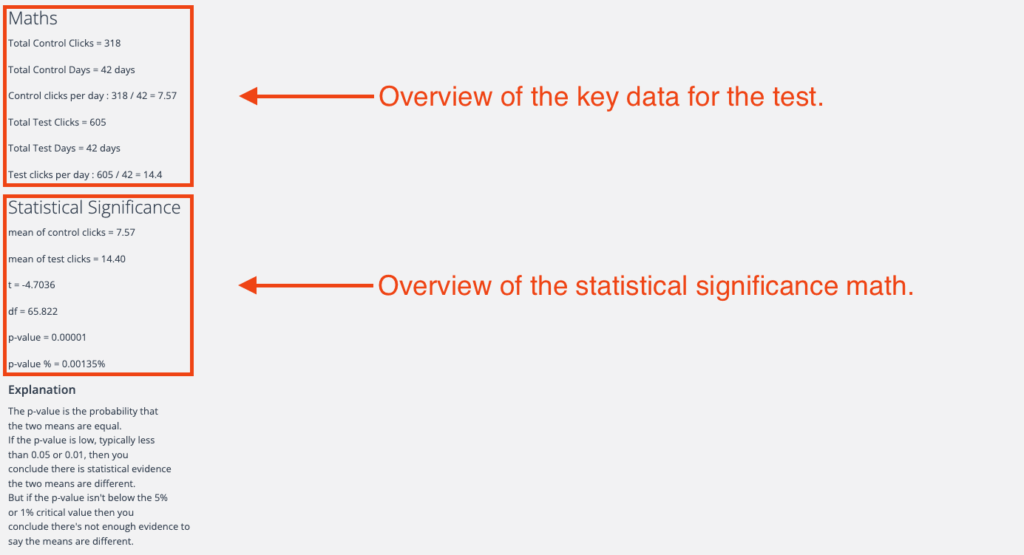
Clicks:
- Before: 318 total (7.57 per day)
- After: 605 total (14.4 per day)
- That’s a 90% jump in daily clicks.
Other metrics showed improvements, too:
- Our average position improved from Position 29 to Position 17.
- We increased our click-through rate significantly.
- Our impressions stayed stable, confirming the ranking boost drove results.
Statistical Analysis
We ran a t-test in order to determine if the 90% click increase that we saw post-test was statistically significant.
- Mean control clicks per day: 7.57
- Mean test clicks per day: 14.40
- T-statistic: -4.7036
- P-value: 0.00001 (0.00135%)
Conclusion: With a p-value of 0.00135%, we can be 99.99% confident that our content changes caused the traffic increase. This far exceeds the standard 95% confidence threshold.
Why It Worked
This test led to a positive result because we:
- Amended our content to make it more focused and readable.
- Targeted actual search queries with headings throughout the article.
- Optimized our meta tags to match the user intent.
- Tracked the right metric (for us, clicks) for 42 days.
This example shows how SEOTesting automatically calculated statistical significance for us.
We didn’t have to mess with stats or run any tests by hand.
SEOTesting did the heavy lifting and showed us clear results we could trust.
When to Ignore Statistical Significance
While statistical significance is crucial for most SEO tests, there are some scenarios where you might need to make decisions without it. This by no means you abandon data-driven decisions, it means understanding when the traditional statistical significance framework doesn’t apply.
Consider this scenario:
You’re targeting a high-value keyword that generates 20-30 clicks per month. The keyword drives qualified leads worth thousands of dollars each, but the low search volume makes achieving statistical significance nearly impossible.
In a time-based SEO test, you might see:
- Before Period: 145 clicks, average position of 8.2
- After Period: 165 clicks, average position of 5.1
This 14% increase in clicks and significant position improvement may never reach statistical significance due to the small sample size. But the business impact could be substantial!
Mistakes to Avoid
Here are common slip-ups in SEO testing to watch out for:
Ending Tests Too Early
Strong early results can trick you. You might feel like ending the test early. Don’t.
Let the full test run. That time buffer helps smooth out random highs and lows.
If you stop early you risk thinking something worked when it didn’t.
Not Setting a Hypothesis
Testing without a clear hypothesis leads to random testing.
You need a specific prediction about what will happen and why. This guides your test design and prevents cherry picking results.
Misreading Statistical Significance Data
Statistical significance doesn’t mean practical significance.
A 1% improvement might be statistically significant but not worth implementing. Consider the cost and effort required.
Also, non-significant results don’t prove your change doesn’t work. You might just need a larger sample size or a longer test duration.
Ignoring External Events
Things like Google updates, busy shopping periods, or new ads can change your results.
Keep an eye on these during your test. Write down anything that could affect what you see.
When in doubt, extend your test or start over after conditions stabilize.
SEO Testing Resources
If you want to learn more about SEO testing in general, we have some great resources to highlight for you:
Wrapping Things Up
Statistical significance separates real SEO wins from random luck.
It helps you know if your changes really made a difference. Without it you risk guessing and making the wrong call.
Keep these basics in mind:
- Start with a clear hypothesis.
- Make sure your test runs long enough and has enough data.
- Watch out for things like seasonality or Google updates.
- Base your choices on the numbers not your instincts.
You don’t need to be a stats expert. Most SEO tools do the hard math for you.
Ready to Run Statistically Significant SEO Tests?
SEOTesting makes statistical significance simple. Our platform automatically calculates p-values and all other information you need to calculate statistical significance for all of your SEO tests.
You focus on strategy and make the changes. We handle everything else.
Start your 14-day free trial today and run your first statistically significant SEO test.
Testimonials
-

"Can totally recommend! It’s not only full of reports to easily identify low hanging fruit opportunities but also, the most straightforward platform to help run SEO tests"
Aleyda Solis, Intl SEO Consultant, Speaker & Author.
-

"SEOTesting.com has become one of my go-to SEO tools because it does so much with all the valuable data hidden in Google Search Console. It's the only thing that gives us the ability to use that data for keyword tracking, SEO tests, and quality testing."
Ruben Gamez, DocSketch