At SEOTesting, we understand the importance of finding the impact of your digital marketing efforts, particularly in differentiating between organic and paid traffic when using tools like Google Search Console. This blog post explores the functionalities of Google Search Console, the type of data it records, the metrics it tracks for you, and how to identify and analyze your paid traffic.
So let’s get into it.
Can You See Paid Traffic in Google Search Console?
No. Paid traffic data cannot be seen directly within Google Search Console itself.
GSC is a tool designed to focus on organic search traffic explicitly. Because of that, it provides data related to how your website performs in Google’s organic search results only.
For insights into paid traffic, you need to use another Google-built tool, such as Google Ads or GA4, but we will go through this later.
What Data Does Google Search Console Show?
Okay, what data does Google Search Console show you as a user? We’ll answer all of that in this next section.
Queries
One of the main pieces of data Google Search Console can show you is the list of queries searchers use to find your site in organic search results. GSC can show you what people search on Google to find your website.
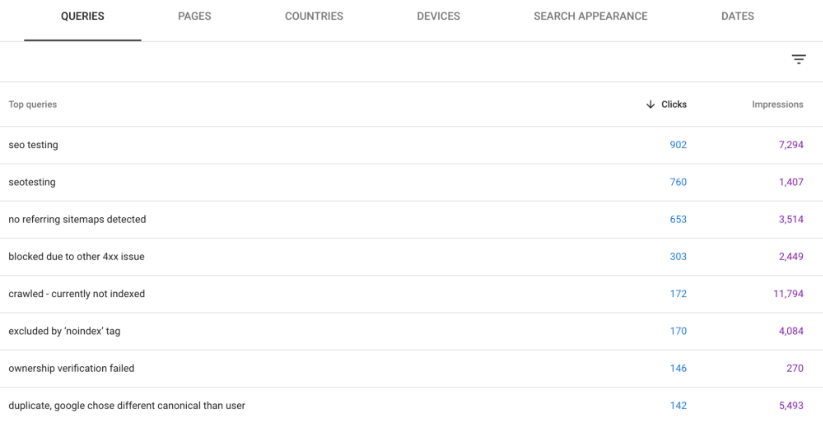
This is excellent information as it allows you, as a marketer, to see what queries you are targeting are working well and which queries need more attention. This prevents several problems, including wasted time, wasted budget, and outright focusing on the wrong keywords for your business.
Pages
Google Search Console can also provide helpful information on which pages on your site are most found within Google’s organic search features. Here’s an example for the SEOTesting website:
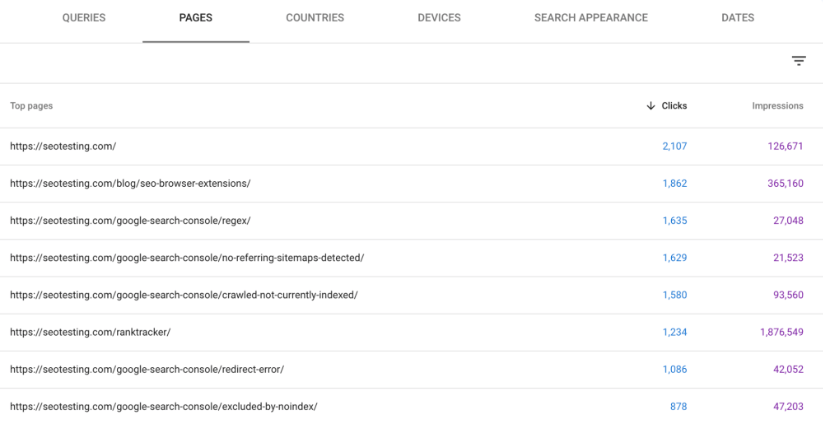
As you can see, our homepage is currently the most popular page on our website, followed by our blog post on SEO browser extensions and our blog post on how Google Search Console uses RegEx.
As a marketer, you’ll find this hugely beneficial as (much like with the data shown for queries) you can see which pages are popular with searchers and which pages you might need to focus on a little more. For example, if you are running a content website and find that one of your pages is seeing significantly more traffic than the others, you can dive deeper into this to find out why. It might be possible to replicate something done on this page on your other pages to increase overall website traffic.
Countries
You can also see the countries where your website generates traffic within Google Search Console. Here’s the example from the SEOTesting site:
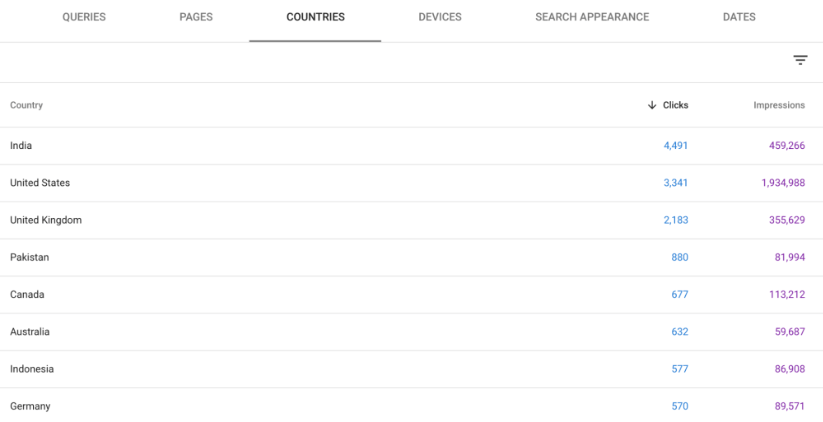
As you can see, the top countries we receive traffic from are:
- India
- The USA
- The UK
- Pakistan
- Canada
This information is hugely valuable to you as a marketer, content creator, or anyone else working on the site, especially when you consider that you can see the click and impression data for each country, too.
As we can see in the screenshot above, the SEOTesting website receives significantly more impressions from Google searches in the US than it does in the UK and India but fewer clicks overall, which signals a low CTR. We can now research why this is and see if there’s any way to fix it. It might be the case that we re-write some meta information to encourage clicks from US-based searchers or that the SERPs look different in the US when compared to other countries.
Devices
Marketers can also use Google Search Console to see how their website performs on different devices. As you can see from the screenshot below, the SEOTesting website generates organic traffic from desktop devices, mobile devices, and tablet devices. This is the same for all websites, but the split of traffic and impressions will differ based on various factors, including location and how the SERPs are shown on each device.
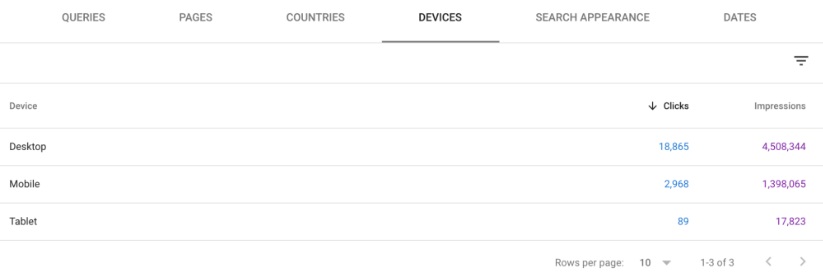
This is excellent information. We can see that we get a healthy number of impressions and clicks from desktop traffic, but we can also see a good number of clicks and impressions from mobile traffic. If we work out our click-through rate for each, we get the following results:
- Desktop Click-Through Rate: 0.42%
- Mobile Click-Through Rate: 0.21%
We can see that our desktop click-through rate is double that of our mobile click-through rate, which now gives us a look into what we can target… Boosting our mobile click-through rate!
Search Appearance
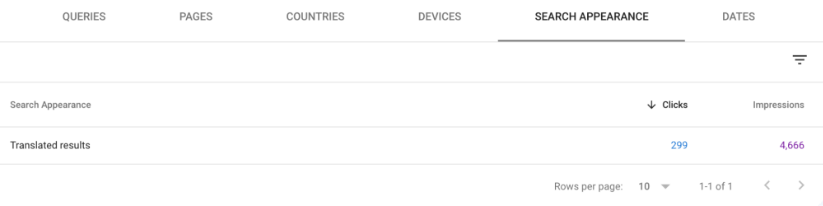
We can also use GSC to see what search features are used when people find our site through Google’s organic results. Let’s take a look at our results over the past three months:
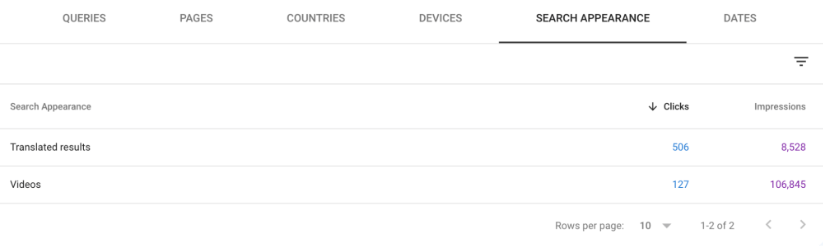
Great. This tells us something! What about over the last sixteen months?
Brilliant.
As we can see, we get a large number of clicks from searchers who make use of Google’s translated results feature. This makes sense, given that we get traffic from countries such as India, Pakistan, Germany, and the Netherlands. As we extend the date from three to sixteen months, we can also see that we get traffic via videos embedded on our site.
This also tells us that we’re ‘lacking’ in several areas. There’s no traffic from Google Discover, no traffic from featured snippets, etc. So we now have a new area of focus, as we could certainly be generating organic traffic from these areas, too.
Dates
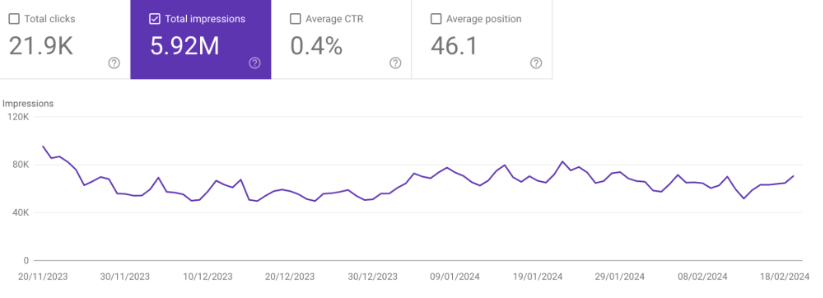
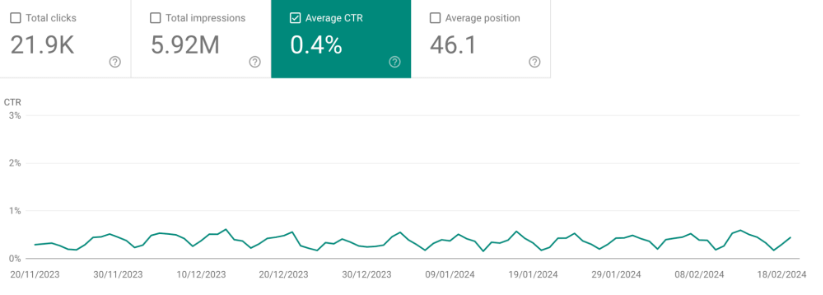
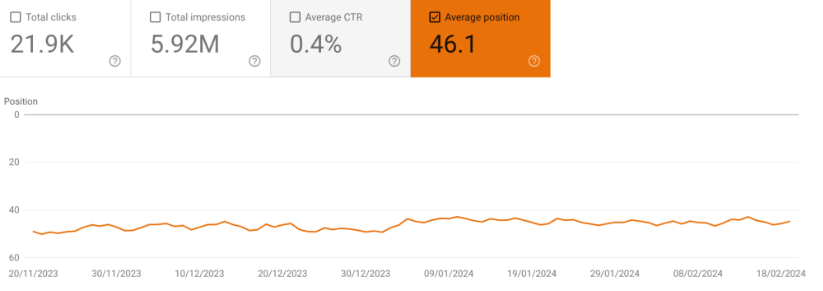
Finally, we can use Google Search Console to see click and impression data over various dates:
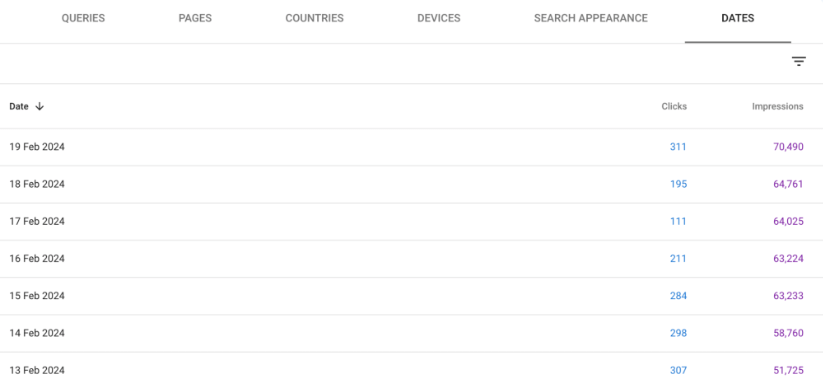
Whilst this doesn’t tell us much, we can use it to segment the data more. We can use it to find trends, such as higher traffic on certain days of the week. This is another way of making the data within Google Search Console more straightforward for non-technical folk.
What Metrics Does Google Search Console Track?
Alongside the valuable ways we can see our website displayed within Google Search Console, we can also use GSC to display different metrics for our site. We’ll go through each of these in this next section.
Clicks
Clicks show the number of times people have clicked on your website’s link in search results after searching for a specific thing on Google. This metric shows how effective your website is in terms of search engine visibility and how ‘attractive’ your titles and descriptions are.
Impressions
Impressions show the number of times your website’s link has appeared in Google search results for a particular query or a set of queries. It shows how visible your website is within Google’s search results and the potential reach your content could have!
Average Click-Through Rate
Your average click-through rate is the ratio of clicks to impressions, expressed as a percentage. It measures how effective your titles, meta descriptions, and overall appearance in search are in attracting clicks from users. If your website has a high CTR, more people will see and click on your results in search results.
Average Position
Your average position indicates the typical ranking position of your website’s link in the search results for a specific query. It shows your website’s visibility and competitiveness over other search results. Remember that this is an average and not a flat figure because where your site sits in search depends on many factors, including the location, device used, exact query searched, etc.
How Can I See My Paid Traffic?
Whilst you cannot see any reference to your paid traffic within Google Search Console, there are a couple of other free tools out there, also developed by Google themselves, that you can use to keep track of your paid traffic.
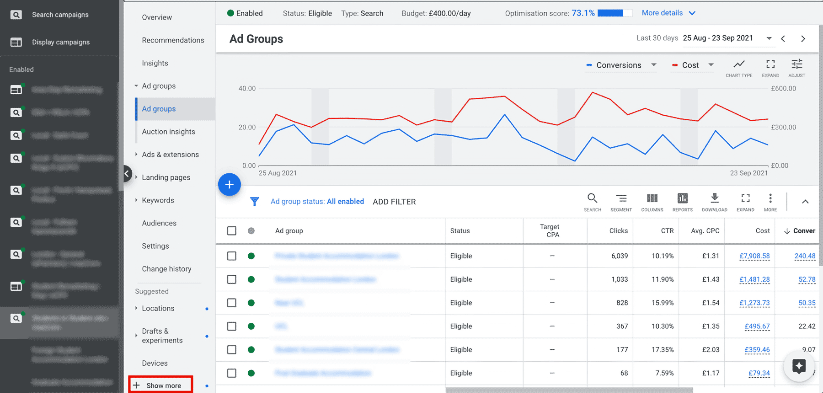
Google Ads Account
For sure, the easiest and quickest way to see and manage your paid traffic is through your Google Ads account. Within your Google Ads dashboard, you can see how each ad campaign performs and the traffic they bring in.
For each campaign, you’ll be able to see:
- The exact ad used.
- The click the ad has generated.
- The CTR of the ad.
- The average CPC (Cost Per Click) of the ad.
- The total cost.
- And the number of conversions that ad has generated.
GA4
If you are looking for a quick overview of your paid traffic, you can also see it in GA4.
Head to your GA4 dashboard, navigate to Reports > Acquisition > User Acquisition using the navigation bar on the left-hand side of your page. From there, you will see a quick overview of how your website is performing and where it is generating users from:
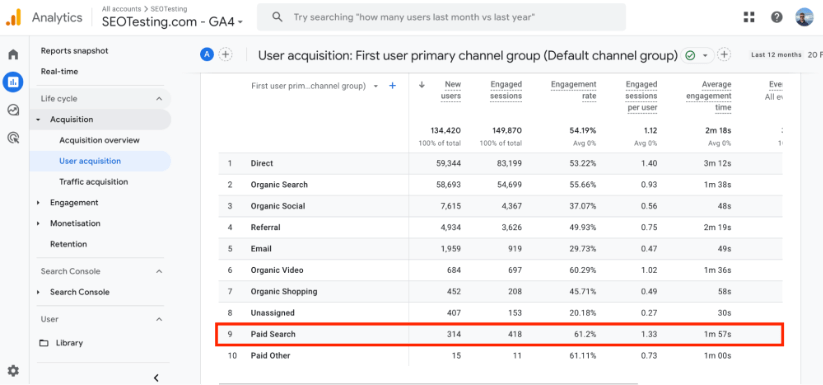
You won’t be able to see as much data here as you can within your Google Ads account, but if you want a quick overview, the data provided by GA4 should be enough. You’ll be able to see:
- The number of users you have received via paid traffic.
- The number of ‘engaged’ sessions received via paid traffic.
- The engagement rate of paid traffic.
- The number of ‘engaged’ sessions per user.
- Your average engagement time.
- The average time spent on your page.
Frequently Asked Questions
Does Google Search Console track paid traffic?
No. Google Search Console only tracks organic search traffic. It does not include data from paid campaigns.
How can I see paid traffic data if it is not in GSC?
You can use Google Ads or GA4 to view paid traffic data. Both tools show clicks, CTR, costs, and conversions for your campaigns.
Why does GSC not show paid traffic?
GSC is built to focus on organic search performance only. Paid traffic is tracked in other Google tools designed for advertising data.
What type of data does GSC track instead?
GSC tracks queries, page clicks, impressions, average position, CTR, traffic by country and device, search appearance, and indexing details.
Can I combine GSC data with paid traffic data?
Yes. You can combine exported GSC data with GA4 or Google Ads data to get a complete picture of organic and paid performance.
Does SEOTesting work with paid traffic data?
SEOTesting uses the Google Search Console API, so it only reports on organic traffic. You can use it alongside GA4 and Google Ads for full reporting.
Wrapping Things Up
In conclusion, Google Search Console (GSC) emerges as a pivotal tool for those seeking to understand and enhance their website’s organic search performance on Google. Offering insights into queries, page popularity, traffic by country, device usage, and search appearance, GSC equips marketers, webmasters, and content creators with valuable data to optimize their strategies.
However, GSC does not incorporate paid traffic data within its analytics. For those looking to delve into the metrics of their paid campaigns, Google Ads and GA4 stand out as essential tools, providing comprehensive details on campaign performance, engagement, and user acquisition.
This differentiation underscores Google’s commitment to offering tailored tools for specific aspects of online visibility, ensuring that users can access the precise data they need to drive organic and paid search success.
If you want to make more of your organic traffic and are out of ideas, SEOTesting might be the tool for you! We make use of Google Search Console’s API to provide you with handy reports that you can use to find more organic traffic. That’s on top of the fantastic range of SEO testing the tool provides you with the ability to do. We offer a free 14-day trial with no credit card, so sign up today and get optimizing!
Testimonials
-

"Can totally recommend! It’s not only full of reports to easily identify low hanging fruit opportunities but also, the most straightforward platform to help run SEO tests"
Aleyda Solis, Intl SEO Consultant, Speaker & Author.
-

"SEOTesting has become one of my go-to SEO tools because it does so much with all the valuable data hidden in Google Search Console. It's the only thing that gives us the ability to use that data for keyword tracking, SEO tests, and quality testing."
Ruben Gamez, DocSketch